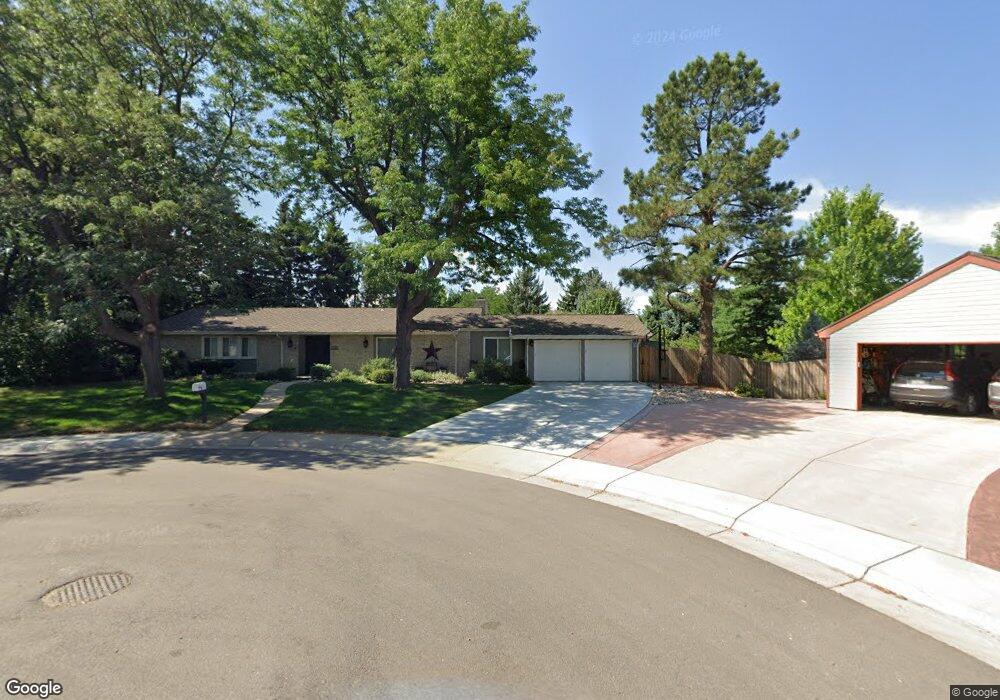
7185 S Xenia Cir Centennial, CO 80112
Walnut Hills NeighborhoodEstimated Value: $730,000 - $807,000
5
Beds
3
Baths
3,018
Sq Ft
$258/Sq Ft
Est. Value
About This Home
This home is located at 7185 S Xenia Cir, Centennial, CO 80112 and is currently estimated at $778,857, approximately $258 per square foot. 7185 S Xenia Cir is a home located in Arapahoe County with nearby schools including Walnut Hills Elementary School, Campus Middle School, and Cherry Creek High School.
Ownership History
Date
Name
Owned For
Owner Type
Purchase Details
Closed on
Oct 21, 2015
Sold by
Majka Angela M and Tyus Joel C
Bought by
Tyus Angela Marie and Tyus Joel Christopher
Current Estimated Value
Home Financials for this Owner
Home Financials are based on the most recent Mortgage that was taken out on this home.
Original Mortgage
$285,000
Outstanding Balance
$224,691
Interest Rate
3.94%
Mortgage Type
New Conventional
Estimated Equity
$554,166
Purchase Details
Closed on
Apr 9, 2012
Sold by
Herrigal Ralph G and Estate Of Dorothy Jean Herrige
Bought by
Majka Angela M and Tyus Jose C
Home Financials for this Owner
Home Financials are based on the most recent Mortgage that was taken out on this home.
Original Mortgage
$302,141
Interest Rate
4.4%
Mortgage Type
FHA
Purchase Details
Closed on
Jul 4, 1776
Bought by
Conversion Arapco
Create a Home Valuation Report for This Property
The Home Valuation Report is an in-depth analysis detailing your home's value as well as a comparison with similar homes in the area
Home Values in the Area
Average Home Value in this Area
Purchase History
| Date | Buyer | Sale Price | Title Company |
|---|---|---|---|
| Tyus Angela Marie | -- | Land Title Guarantee Company | |
| Majka Angela M | $310,000 | Land Title Guarantee Company | |
| Conversion Arapco | -- | -- |
Source: Public Records
Mortgage History
| Date | Status | Borrower | Loan Amount |
|---|---|---|---|
| Open | Tyus Angela Marie | $285,000 | |
| Closed | Majka Angela M | $302,141 |
Source: Public Records
Tax History Compared to Growth
Tax History
| Year | Tax Paid | Tax Assessment Tax Assessment Total Assessment is a certain percentage of the fair market value that is determined by local assessors to be the total taxable value of land and additions on the property. | Land | Improvement |
|---|---|---|---|---|
| 2024 | $4,373 | $47,228 | -- | -- |
| 2023 | $4,373 | $47,228 | $0 | $0 |
| 2022 | $3,827 | $39,261 | $0 | $0 |
| 2021 | $3,856 | $39,261 | $0 | $0 |
| 2020 | $3,438 | $35,514 | $0 | $0 |
| 2019 | $3,323 | $35,514 | $0 | $0 |
| 2018 | $3,217 | $32,731 | $0 | $0 |
| 2017 | $3,184 | $32,731 | $0 | $0 |
| 2016 | $3,183 | $31,084 | $0 | $0 |
| 2015 | $3,067 | $31,084 | $0 | $0 |
| 2014 | -- | $24,573 | $0 | $0 |
| 2013 | -- | $23,800 | $0 | $0 |
Source: Public Records
Map
Nearby Homes
- 8866 E Easter Ave
- 7065 S Willow St
- 7346 S Xenia Cir Unit A
- 8653 E Dry Creek Rd Unit 1126
- 8671 E Dry Creek Rd Unit 721
- 8747 E Dry Creek Rd Unit 1627
- 8550 E Davies Place
- 8481 E Briarwood Blvd
- 8717 E Dry Creek Rd Unit 1928
- 8381 E Briarwood Blvd
- 8603 E Dry Creek Rd Unit 211
- 9079 E Panorama Cir Unit 208
- 9079 E Panorama Cir Unit 304
- 9079 E Panorama Cir Unit 512
- 9079 E Panorama Cir Unit 313
- 9079 E Panorama Cir Unit 209
- 9079 E Panorama Cir Unit 419
- 9079 E Panorama Cir Unit 309
- 7337 S Ulster St
- 9059 E Panorama Cir Unit B314
- 8781 E Fremont Cir
- 7175 S Xenia Cir
- 7174 S Xenia Cir
- 8813 E Fremont Cir
- 8751 E Fremont Cir
- 8863 E Fremont Cir
- 7155 S Xenia Cir
- 7154 S Xenia Cir
- 8731 E Fremont Cir
- 7172 S Xanthia St
- 7162 S Xanthia St
- 7144 S Xenia Cir
- 8852 E Easter Place
- 8884 E Fremont Cir
- 8701 E Fremont Cir
- 7142 S Xanthia St
- 8792 E Fremont Cir
- 8772 E Fremont Cir
- 8752 E Fremont Cir
- 8824 E Fremont Cir