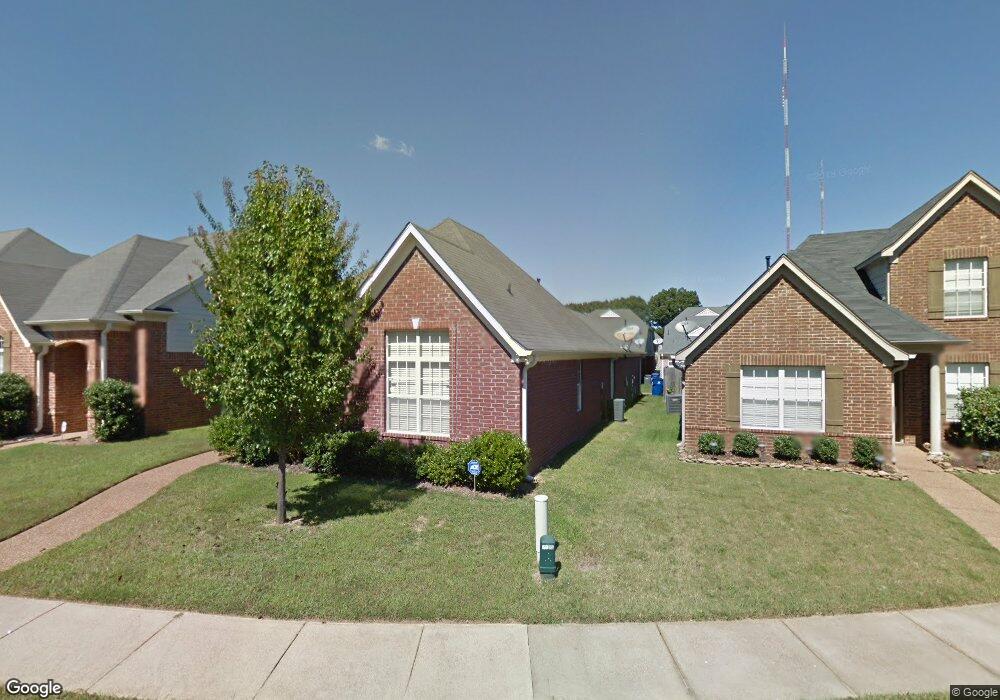
7188 Chena Bay Ln Cordova, TN 38018
Cordova NeighborhoodEstimated Value: $230,713 - $245,000
3
Beds
2
Baths
1,537
Sq Ft
$155/Sq Ft
Est. Value
About This Home
This home is located at 7188 Chena Bay Ln, Cordova, TN 38018 and is currently estimated at $238,178, approximately $154 per square foot. 7188 Chena Bay Ln is a home located in Shelby County with nearby schools including Dexter Elementary School, Dexter Middle School, and Cordova High School.
Ownership History
Date
Name
Owned For
Owner Type
Purchase Details
Closed on
Mar 6, 2020
Sold by
Investor Nation Residential Capital Llc
Bought by
Straatman Kristin M and Straatman James R
Current Estimated Value
Home Financials for this Owner
Home Financials are based on the most recent Mortgage that was taken out on this home.
Original Mortgage
$142,400
Outstanding Balance
$126,116
Interest Rate
3.5%
Mortgage Type
New Conventional
Estimated Equity
$112,062
Purchase Details
Closed on
Jan 21, 2020
Sold by
Kingsbury Jerry D and Kingsbury Diana Liza
Bought by
Investor Nationa Residential Capital Llc
Home Financials for this Owner
Home Financials are based on the most recent Mortgage that was taken out on this home.
Original Mortgage
$142,400
Outstanding Balance
$126,116
Interest Rate
3.5%
Mortgage Type
New Conventional
Estimated Equity
$112,062
Purchase Details
Closed on
Dec 22, 2017
Sold by
Kingsbury Jerry Daniel
Bought by
Jimenez Kingsbury Diana Liza
Create a Home Valuation Report for This Property
The Home Valuation Report is an in-depth analysis detailing your home's value as well as a comparison with similar homes in the area
Home Values in the Area
Average Home Value in this Area
Purchase History
| Date | Buyer | Sale Price | Title Company |
|---|---|---|---|
| Straatman Kristin M | $178,000 | Haven Title Llc | |
| Investor Nationa Residential Capital Llc | $132,000 | None Available | |
| Jimenez Kingsbury Diana Liza | -- | None Available |
Source: Public Records
Mortgage History
| Date | Status | Borrower | Loan Amount |
|---|---|---|---|
| Open | Straatman Kristin M | $142,400 |
Source: Public Records
Tax History Compared to Growth
Tax History
| Year | Tax Paid | Tax Assessment Tax Assessment Total Assessment is a certain percentage of the fair market value that is determined by local assessors to be the total taxable value of land and additions on the property. | Land | Improvement |
|---|---|---|---|---|
| 2025 | $1,568 | $64,250 | $10,650 | $53,600 |
| 2024 | $1,568 | $46,250 | $8,775 | $37,475 |
| 2023 | $1,568 | $46,250 | $8,775 | $37,475 |
| 2022 | $1,568 | $46,250 | $8,775 | $37,475 |
| 2021 | $1,596 | $46,250 | $8,775 | $37,475 |
| 2020 | $1,323 | $32,675 | $8,775 | $23,900 |
| 2019 | $1,323 | $32,675 | $8,775 | $23,900 |
| 2018 | $1,323 | $32,675 | $8,775 | $23,900 |
| 2017 | $1,343 | $32,675 | $8,775 | $23,900 |
| 2016 | $1,279 | $29,275 | $0 | $0 |
| 2014 | $1,279 | $29,275 | $0 | $0 |
Source: Public Records
Map
Nearby Homes
- 7247 Winterbrook Ln
- 7303 Winterbrook Ln
- 7420 Dal Whinnie Trail
- 887 Dalemore Ln
- 7486 Dal Whinnie Trail
- 7194 Charlton Way
- 7468 Links View Ln S
- 1089 Links View Ln W
- 7494 Links View Ln S
- 6890 Century Oaks Dr
- 6884 Wrigley Dr
- 6880 Wrigley Dr
- 7565 Wintergreen Ln
- 1102 Mirror Lake Ln
- 956 Spinnaker Ln
- 1382 Exbury Dr
- 1277 Winter Springs Ln
- 6840 Kamali Ave
- 1321 Winter Springs Ln
- 6774 Whitten Pine Dr
- 7184 Chena Bay Ln
- 7200 Chena Bay Ln
- 7180 Chena Bay Ln
- 7176 Chena Bay Ln
- 7191 Tivoli Ln
- 7195 Tivoli Ln
- 7187 Tivoli Ln
- 7199 Tivoli Ln
- 7183 Tivoli Ln
- 7170 Chena Bay Ln
- 7185 Chena Bay Ln
- 7181 Chena Bay Ln
- 7205 Tivoli Ln
- 7179 Tivoli Ln
- 7193 Chena Bay Ln
- 7205 Chena Bay Ln
- 886 Tamarind Ln
- 7177 Chena Bay Ln
- 7201 Chena Bay Ln
- 890 Tamarind Ln