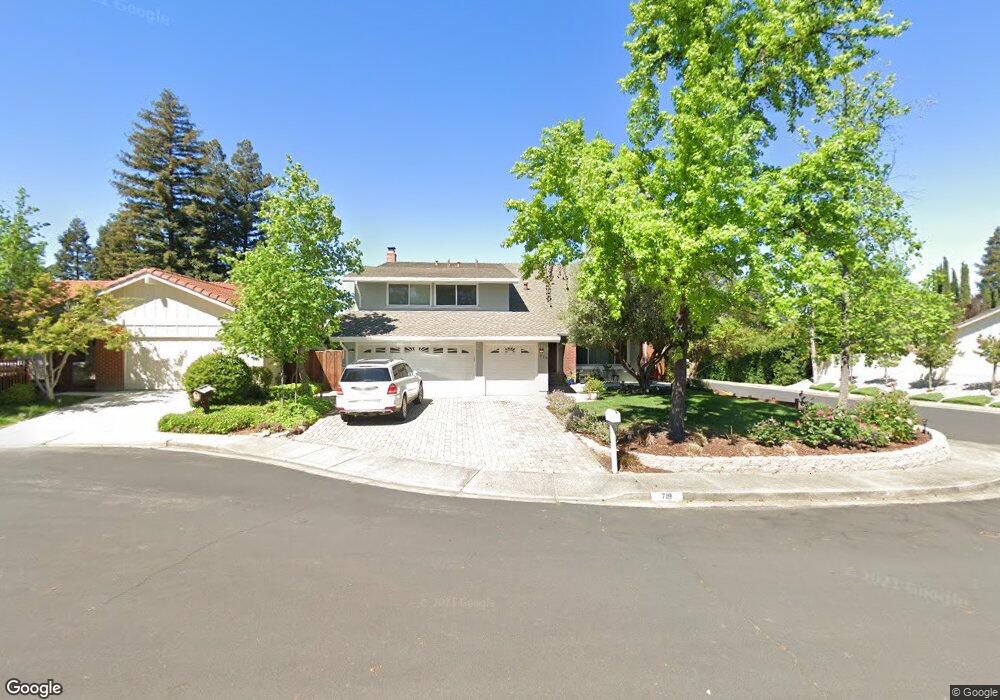
719 Cattail Ct Walnut Creek, CA 94598
Estimated Value: $1,482,000 - $1,689,069
5
Beds
3
Baths
2,681
Sq Ft
$577/Sq Ft
Est. Value
About This Home
This home is located at 719 Cattail Ct, Walnut Creek, CA 94598 and is currently estimated at $1,545,767, approximately $576 per square foot. 719 Cattail Ct is a home located in Contra Costa County with nearby schools including Valle Verde Elementary School, Foothill Middle School, and Northgate High School.
Ownership History
Date
Name
Owned For
Owner Type
Purchase Details
Closed on
Jul 21, 2017
Sold by
Messman Messman C and Messman Elizabeth R
Bought by
Lin Cui Qiu and Zheng De Dong
Current Estimated Value
Purchase Details
Closed on
Jun 28, 2012
Sold by
Messman C David and Messman Elizabeth R
Bought by
Messman C David and Messman Elizabeth R
Purchase Details
Closed on
Jun 6, 1996
Sold by
Gittleman Martin S and Gittleman Rachel
Bought by
Messman C David and Messman Elizabeth R
Home Financials for this Owner
Home Financials are based on the most recent Mortgage that was taken out on this home.
Original Mortgage
$297,000
Interest Rate
7.5%
Mortgage Type
Purchase Money Mortgage
Create a Home Valuation Report for This Property
The Home Valuation Report is an in-depth analysis detailing your home's value as well as a comparison with similar homes in the area
Home Values in the Area
Average Home Value in this Area
Purchase History
| Date | Buyer | Sale Price | Title Company |
|---|---|---|---|
| Lin Cui Qiu | $980,000 | Lawyers Title Company | |
| Messman C David | -- | None Available | |
| Messman C David | $330,000 | Commonwealth Land Title Co |
Source: Public Records
Mortgage History
| Date | Status | Borrower | Loan Amount |
|---|---|---|---|
| Previous Owner | Messman C David | $297,000 |
Source: Public Records
Tax History Compared to Growth
Tax History
| Year | Tax Paid | Tax Assessment Tax Assessment Total Assessment is a certain percentage of the fair market value that is determined by local assessors to be the total taxable value of land and additions on the property. | Land | Improvement |
|---|---|---|---|---|
| 2025 | $12,811 | $1,115,066 | $637,181 | $477,885 |
| 2024 | $12,606 | $1,093,203 | $624,688 | $468,515 |
| 2023 | $12,606 | $1,071,769 | $612,440 | $459,329 |
| 2022 | $12,496 | $1,050,755 | $600,432 | $450,323 |
| 2021 | $12,220 | $1,030,153 | $588,659 | $441,494 |
| 2019 | $11,973 | $999,600 | $571,200 | $428,400 |
| 2018 | $11,542 | $980,000 | $560,000 | $420,000 |
| 2017 | $5,793 | $472,346 | $210,408 | $261,938 |
| 2016 | $5,647 | $463,085 | $206,283 | $256,802 |
| 2015 | $5,597 | $456,130 | $203,185 | $252,945 |
| 2014 | $5,514 | $447,196 | $199,205 | $247,991 |
Source: Public Records
Map
Nearby Homes
- 455 Kit Fox Ct
- 2975 Hurlstone Ct
- 3158 Hambletonian Ln
- 825 Bertram St
- 460 Silver Hollow Dr
- 165 Pine Creek Rd
- 1101 N Gate Rd
- 817 Cheyenne Dr
- 110 Renwick Place
- 924 Cheyenne Dr
- 942 Cheyenne Dr
- 401 Pine Creek Rd
- 1206 N Gate Rd
- 401 Seville Ln
- 206 Hamlin Loop
- 2233 Lomond Ln
- 3638 Perada Dr
- 232 Clyde Dr
- 517 Heather Grove Ct
- 415 Blackstone Ct
- 783 Cattail Ct
- 697 Barn Owl Ct
- 704 Farm Hill Ct
- 716 Cattail Ct
- 780 Cattail Ct
- 715 Whitehaven Ct
- 730 Farm Hill Ct
- 636 New Seabury Ct
- 704 Whitehaven Ct
- 681 Barn Owl Ct
- 766 Farm Hill Ct
- 632 New Seabury Ct
- 686 Barn Owl Ct
- 737 Whitehaven Ct
- 657 Barn Owl Ct
- 626 New Seabury Ct
- 753 Bramble Ct
- 726 Whitehaven Ct
- 792 Farm Hill Ct
- 787 Bramble Ct