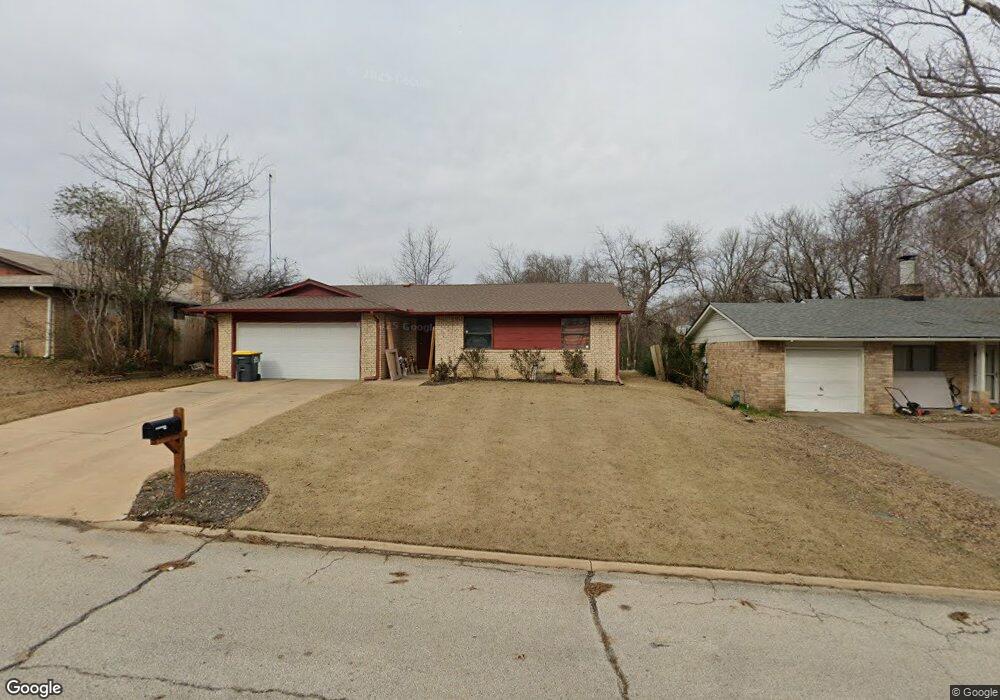
719 E 133rd Place Glenpool, OK 74033
Estimated Value: $176,000 - $189,000
3
Beds
1
Bath
1,032
Sq Ft
$176/Sq Ft
Est. Value
About This Home
This home is located at 719 E 133rd Place, Glenpool, OK 74033 and is currently estimated at $181,832, approximately $176 per square foot. 719 E 133rd Place is a home located in Tulsa County with nearby schools including Glenpool Elementary School, Glenpool Middle School, and Glenpool High School.
Ownership History
Date
Name
Owned For
Owner Type
Purchase Details
Closed on
Mar 14, 2015
Sold by
Miller Crystal G and Miller Christopher L
Bought by
Miller Christopher L
Current Estimated Value
Purchase Details
Closed on
May 23, 2008
Sold by
Miller Crystal G and Miller Christopher
Bought by
Miller Chrystal G and Miller Christopher L
Home Financials for this Owner
Home Financials are based on the most recent Mortgage that was taken out on this home.
Original Mortgage
$84,854
Outstanding Balance
$53,287
Interest Rate
5.89%
Mortgage Type
New Conventional
Estimated Equity
$128,545
Purchase Details
Closed on
Oct 7, 2002
Sold by
Blaine Terry L
Bought by
Alexander Crystal and Miller Christopher
Purchase Details
Closed on
Oct 27, 1997
Sold by
Blaine Kevin R
Bought by
Blaine Terry L
Purchase Details
Closed on
Jun 20, 1997
Sold by
Blaine Kevin R
Bought by
Blaine Terry L
Purchase Details
Closed on
Jan 1, 1988
Purchase Details
Closed on
Oct 1, 1987
Create a Home Valuation Report for This Property
The Home Valuation Report is an in-depth analysis detailing your home's value as well as a comparison with similar homes in the area
Home Values in the Area
Average Home Value in this Area
Purchase History
| Date | Buyer | Sale Price | Title Company |
|---|---|---|---|
| Miller Christopher L | $500 | First American Title Insuran | |
| Miller Chrystal G | -- | None Available | |
| Alexander Crystal | $72,000 | The Executive Title & Escrow | |
| Blaine Terry L | -- | Guaranty Abstract Company | |
| Blaine Terry L | -- | -- | |
| -- | $40,000 | -- | |
| -- | $35,500 | -- |
Source: Public Records
Mortgage History
| Date | Status | Borrower | Loan Amount |
|---|---|---|---|
| Open | Miller Chrystal G | $84,854 |
Source: Public Records
Tax History
| Year | Tax Paid | Tax Assessment Tax Assessment Total Assessment is a certain percentage of the fair market value that is determined by local assessors to be the total taxable value of land and additions on the property. | Land | Improvement |
|---|---|---|---|---|
| 2025 | $1,560 | $13,014 | $1,774 | $11,240 |
| 2024 | $1,382 | $12,394 | $1,792 | $10,602 |
| 2023 | $1,382 | $11,803 | $1,903 | $9,900 |
| 2022 | $1,296 | $11,242 | $2,273 | $8,969 |
| 2021 | $1,253 | $10,706 | $2,164 | $8,542 |
| 2020 | $1,261 | $10,694 | $2,162 | $8,532 |
| 2019 | $1,209 | $10,185 | $2,059 | $8,126 |
| 2018 | $1,154 | $9,760 | $1,973 | $7,787 |
| 2017 | $1,075 | $9,295 | $1,879 | $7,416 |
| 2016 | $1,086 | $9,295 | $1,879 | $7,416 |
| 2015 | $981 | $9,717 | $1,879 | $7,838 |
| 2014 | $953 | $9,167 | $1,773 | $7,394 |
Source: Public Records
Map
Nearby Homes
- 582 E 133rd Place
- 603 E 135th Place
- 13294 S Maple St
- 13653 S Hickory Place
- 1218 E 133rd Place
- 13804 S Glen Place
- 1211 E 135th St
- 0 136th Place Unit 2611872
- 1104 E 137th St
- 1159 E 137th St
- 265 E Glenpool Blvd
- 1309 E 135th St S
- 13761 S Nyssa Ct
- 14037 S Glen St
- 2355 E 135th Place
- 243 E 141st St
- 1671 E 140th St
- 1664 E 138th St S
- 13659 S Quincy St
- 1188 E 143rd St
- 729 E 133rd Place
- 13341 S Hickory Place
- 0 Hickory St
- 141st & Hickory St
- 141ST Hickory St
- 698 E 133rd Place
- 687 E 133rd Place
- 13372 S Hickory Place
- 13447 S Hickory Place
- 13343 S Hickory St
- 692 E 133rd Place
- 673 E 133rd Place
- 680 E 133rd Place
- 13475 S Hickory Place
- 13468 S Hickory Place
- 693 E 134th St
- 672 E 133rd Place
- 13483 S Hickory Place
- 681 E 134th St
- 653 E 133rd Place
Your Personal Tour Guide
Ask me questions while you tour the home.