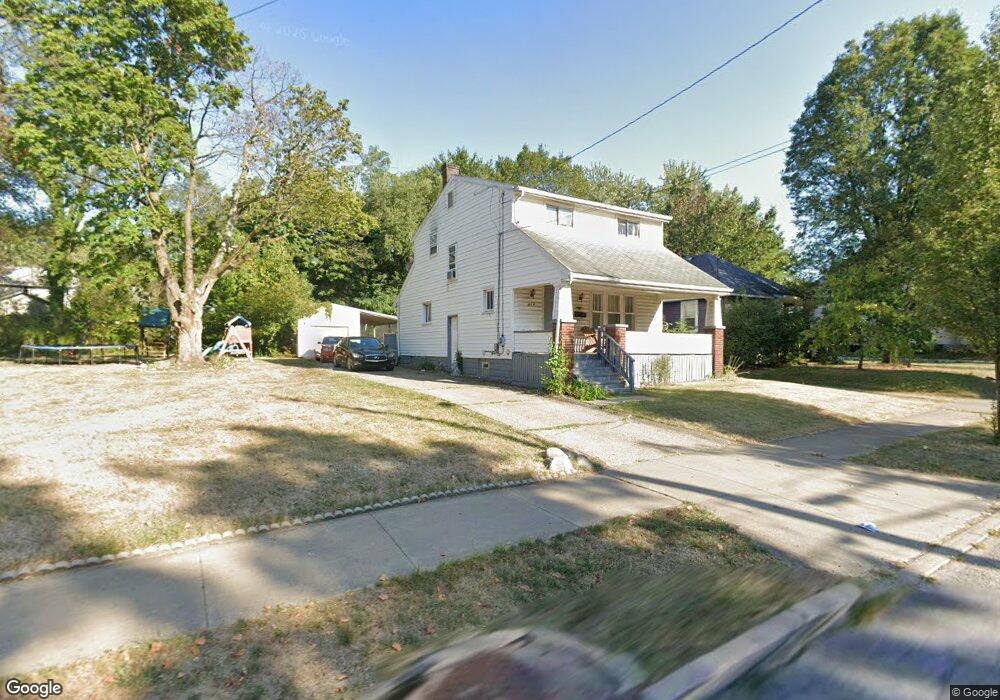
719 Inman St Akron, OH 44306
East Akron NeighborhoodEstimated Value: $79,000 - $104,000
3
Beds
1
Bath
1,228
Sq Ft
$75/Sq Ft
Est. Value
About This Home
This home is located at 719 Inman St, Akron, OH 44306 and is currently estimated at $92,461, approximately $75 per square foot. 719 Inman St is a home located in Summit County with nearby schools including Glover Community Learning Center, Kenmore Garfield Community Learning Center, and Main Preparatory Academy.
Ownership History
Date
Name
Owned For
Owner Type
Purchase Details
Closed on
Jan 26, 2009
Sold by
Mckinney Deborah
Bought by
Tradewind Land Investment Corp
Current Estimated Value
Purchase Details
Closed on
May 7, 2008
Sold by
The Bank Of New York Trust Co Na
Bought by
Mckinney Deborah
Purchase Details
Closed on
Jan 4, 2008
Sold by
Woods Terea M
Bought by
The Bank Of New York Trust Co Na and Jpmorgan Chase Bank Na
Purchase Details
Closed on
Mar 31, 1998
Sold by
Florek Terrence D
Bought by
Woods Terea M
Purchase Details
Closed on
Dec 26, 1997
Sold by
Florek Terrence D
Bought by
Woods Terea M
Purchase Details
Closed on
Jan 23, 1996
Sold by
Florek Terrence D
Bought by
Woods Terea M
Create a Home Valuation Report for This Property
The Home Valuation Report is an in-depth analysis detailing your home's value as well as a comparison with similar homes in the area
Home Values in the Area
Average Home Value in this Area
Purchase History
| Date | Buyer | Sale Price | Title Company |
|---|---|---|---|
| Tradewind Land Investment Corp | -- | None Available | |
| Mckinney Deborah | $11,500 | Attorney | |
| The Bank Of New York Trust Co Na | $52,000 | None Available | |
| Woods Terea M | $50,000 | -- | |
| Woods Terea M | $49,000 | -- | |
| Woods Terea M | $49,900 | -- |
Source: Public Records
Mortgage History
| Date | Status | Borrower | Loan Amount |
|---|---|---|---|
| Closed | Woods Terea M | $0 | |
| Closed | Woods Terea M | -- |
Source: Public Records
Tax History Compared to Growth
Tax History
| Year | Tax Paid | Tax Assessment Tax Assessment Total Assessment is a certain percentage of the fair market value that is determined by local assessors to be the total taxable value of land and additions on the property. | Land | Improvement |
|---|---|---|---|---|
| 2025 | $1,100 | $19,478 | $3,917 | $15,561 |
| 2024 | $1,100 | $19,478 | $3,917 | $15,561 |
| 2023 | $1,100 | $19,478 | $3,917 | $15,561 |
| 2022 | $905 | $12,411 | $2,303 | $10,108 |
| 2021 | $906 | $12,411 | $2,303 | $10,108 |
| 2020 | $893 | $12,410 | $2,300 | $10,110 |
| 2019 | $998 | $12,710 | $3,250 | $9,460 |
| 2018 | $985 | $12,710 | $3,250 | $9,460 |
| 2017 | $1,204 | $12,710 | $3,250 | $9,460 |
| 2016 | $1,204 | $14,950 | $3,890 | $11,060 |
| 2015 | $1,204 | $14,950 | $3,890 | $11,060 |
| 2014 | $1,245 | $14,950 | $3,890 | $11,060 |
| 2013 | $1,325 | $16,410 | $3,890 | $12,520 |
Source: Public Records
Map
Nearby Homes
- 696 Inman St
- 836 5th Ave
- 720 E Crosier St
- 939 E Crosier St
- 823 Merton Ave
- 522 Winans Ave
- 548 Winans Ave
- 495 Elbon Ave
- 920 Rowe St
- 694 Virginia Ave
- 877 Bertha Ave
- 622 Talbot Ave
- 724 Virginia Ave
- 713 Virginia Ave
- 970 Allendale Ave
- 717 Virginia Ave
- 426 S Arlington St
- 546 Baird St
- 1043 Coventry St
- 352 Talbot Ave