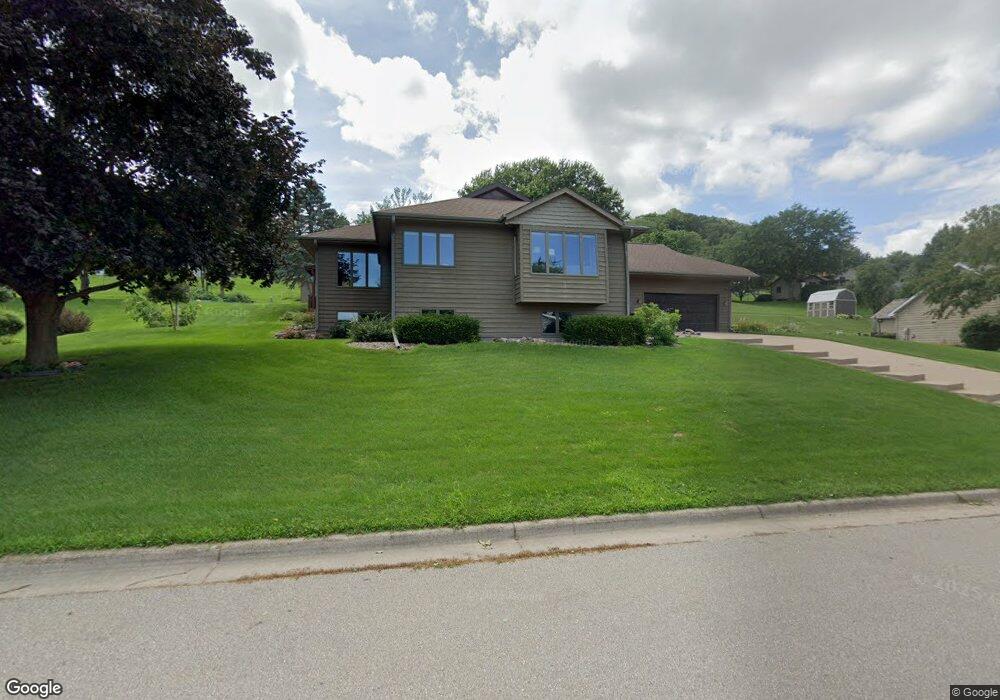
719 Jonathan Ln La Crescent, MN 55947
Estimated Value: $458,496 - $474,000
4
Beds
3
Baths
2,963
Sq Ft
$158/Sq Ft
Est. Value
About This Home
This home is located at 719 Jonathan Ln, La Crescent, MN 55947 and is currently estimated at $466,874, approximately $157 per square foot. 719 Jonathan Ln is a home located in Houston County with nearby schools including La Crescent-Hokah Elementary School, La Crescent-Hokah Middle School, and La Crescent-Hokah High School.
Ownership History
Date
Name
Owned For
Owner Type
Purchase Details
Closed on
Sep 4, 2020
Sold by
Hogan Donny M and Hogan Stacie J
Bought by
Shackleton Jordan S and Hougom Brittany L
Current Estimated Value
Home Financials for this Owner
Home Financials are based on the most recent Mortgage that was taken out on this home.
Original Mortgage
$240,000
Outstanding Balance
$213,375
Interest Rate
3%
Mortgage Type
New Conventional
Estimated Equity
$253,499
Purchase Details
Closed on
Nov 1, 2016
Sold by
Morschhauser Penny L and Schumacher Penny L
Bought by
Hogan Donny M and Hogan Stacie J
Purchase Details
Closed on
May 16, 2012
Sold by
Best Thomas M and Best Betty A
Bought by
Morschhauser Penny L
Home Financials for this Owner
Home Financials are based on the most recent Mortgage that was taken out on this home.
Original Mortgage
$164,800
Interest Rate
3.89%
Mortgage Type
New Conventional
Purchase Details
Closed on
Mar 1, 2010
Sold by
Seyler Dianne M
Bought by
Best Thomas M and Best Betty A
Create a Home Valuation Report for This Property
The Home Valuation Report is an in-depth analysis detailing your home's value as well as a comparison with similar homes in the area
Home Values in the Area
Average Home Value in this Area
Purchase History
| Date | Buyer | Sale Price | Title Company |
|---|---|---|---|
| Shackleton Jordan S | $320,000 | None Available | |
| Hogan Donny M | $238,900 | New Castle Title | |
| Morschhauser Penny L | -- | None Available | |
| Best Thomas M | $210,000 | None Available |
Source: Public Records
Mortgage History
| Date | Status | Borrower | Loan Amount |
|---|---|---|---|
| Open | Shackleton Jordan S | $240,000 | |
| Previous Owner | Morschhauser Penny L | $164,800 |
Source: Public Records
Tax History Compared to Growth
Tax History
| Year | Tax Paid | Tax Assessment Tax Assessment Total Assessment is a certain percentage of the fair market value that is determined by local assessors to be the total taxable value of land and additions on the property. | Land | Improvement |
|---|---|---|---|---|
| 2025 | $5,842 | $448,400 | $78,800 | $369,600 |
| 2024 | $5,790 | $406,400 | $78,800 | $327,600 |
| 2023 | $5,772 | $383,100 | $48,000 | $335,100 |
| 2022 | $5,022 | $383,100 | $48,000 | $335,100 |
| 2021 | $4,982 | $287,900 | $48,000 | $239,900 |
| 2020 | $4,864 | $287,900 | $48,000 | $239,900 |
| 2019 | $4,154 | $280,900 | $48,000 | $232,900 |
| 2018 | $4,552 | $251,800 | $48,000 | $203,800 |
| 2017 | $4,552 | $257,100 | $41,803 | $215,297 |
| 2016 | $4,060 | $270,000 | $43,900 | $226,100 |
| 2015 | $3,828 | $255,600 | $41,500 | $214,100 |
| 2014 | $3,828 | $241,400 | $39,194 | $202,206 |
Source: Public Records
Map
Nearby Homes
- 726 N 4th St
- 540 Jonathan Ln
- 512 N Hill St
- 0 Hill St N
- Lot 7 & 8 Crescent Hills Dr
- 106 Fireside Ct
- 813 Stoney Point Rd
- 28 N Walnut St
- 0 Crescent Hills Dr
- 225 Red Apple Dr
- 220 S Maple St
- 428 Backstretch Ct
- 604 Hickory Ct
- 0 County Road 6 Unit 1941351
- 0 Hickory Ln
- 906 Redwood St E
- 32979 County Road 1
- 1626 Lakeshore Dr
- 645 Pettibone Pointe Way
- 328 River Point
- 723 Jonathan Ln
- 715 Jonathan Ln
- 714 N 4th St
- 710 N 4th St
- 727 Jonathan Ln
- 714 Jonathan Ln
- 730 Jonathan Ln
- 614 Mcintosh Rd
- 718 Jonathan Ln
- 710 Jonathan Ln
- 722 N 4th St
- 722 Jonathan Ln
- 610 Mcintosh Rd
- 618 Mcintosh Rd
- 731 Jonathan Ln
- 615 Mcintosh Rd
- 726 Jonathan Ln
- 742 N 4th St
- 514 Mcintosh Rd
- 715 N 4th St