


719 Judge Mason Way La Vergne, TN 37086
Estimated payment $2,250/month
3
Beds
2
Baths
1,803
Sq Ft
10,454
Sq Ft Lot
Highlights
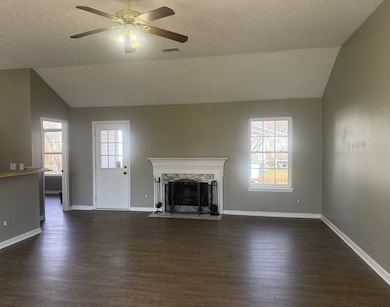
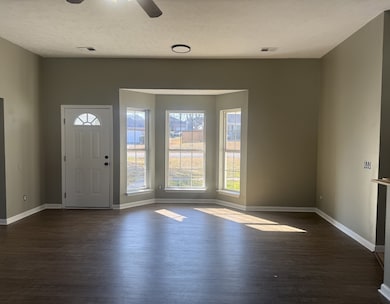
- Open Floorplan
- High Ceiling
- No HOA
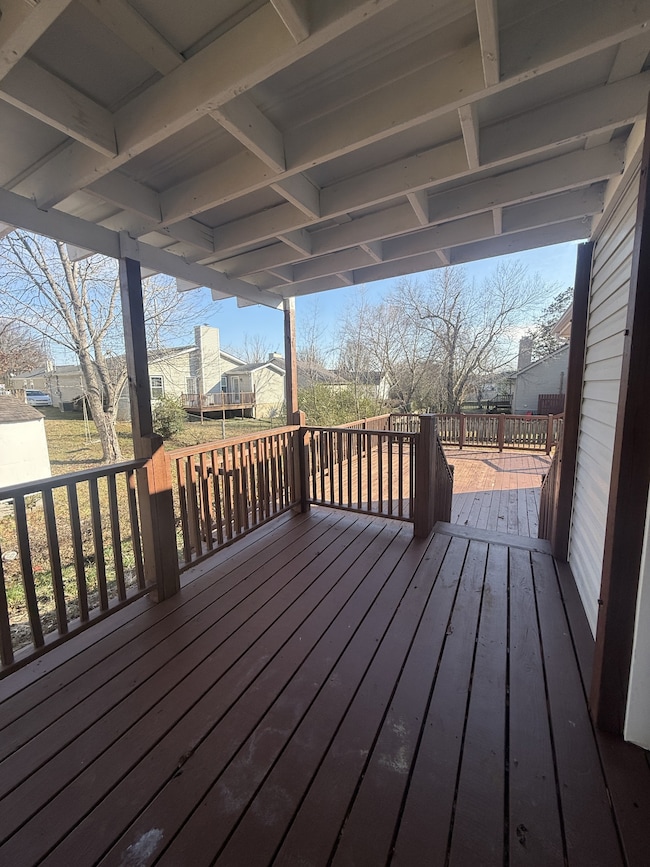
- Deck
- Great Room
- Covered Patio or Porch
About This Home
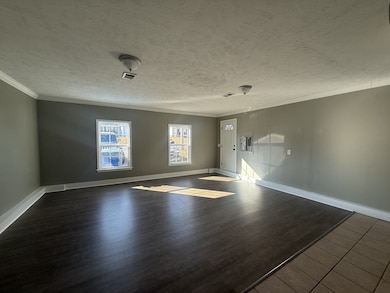
Move in Ready! Professional Photos Coming Soon! Beautiful 3-bedroom home offering the ease of main-level living and stylish updates. Step inside to brand-new luxury vinyl flooring that flows seamlessly through most of the main living areas, complemented by a bright kitchen featuring stainless steel appliances and new granite countertops. The spacious layout includes a large bonus room, perfect for a work out room, media room, or game room. Enjoy outdoor living year-round with a covered deck plus two expansive upper and lower decks—ideal for entertaining, relaxing, or hosting gatherings. This home blends comfort, functionality in a setting designed for both everyday living and special occasions. Professional Photos Coming Soon!
Listing Agent
Onward Real Estate Brokerage Phone: 6152075600 License #258222 Listed on: 12/16/2025
Home Details
Home Type
- Single Family
Est. Annual Taxes
- $1,757
Year Built
- Built in 1996
Lot Details
- 10,454 Sq Ft Lot
- Level Lot
Parking
- Driveway
Home Design
- Shingle Roof
- Vinyl Siding
Interior Spaces
- 1,803 Sq Ft Home
- Property has 1 Level
- Open Floorplan
- High Ceiling
- Ceiling Fan
- Wood Burning Fireplace
- Great Room
- Washer and Electric Dryer Hookup
Kitchen
- Microwave
- Dishwasher
- Stainless Steel Appliances
Flooring
- Tile
- Vinyl
Bedrooms and Bathrooms
- 3 Main Level Bedrooms
- Walk-In Closet
- 2 Full Bathrooms
Outdoor Features
- Deck
- Covered Patio or Porch
Schools
- Lavergne Lake Elementary School
- Lavergne Middle School
- Lavergne High School
Utilities
- Central Heating and Cooling System
Community Details
- No Home Owners Association
- Lake Forest Est Ph 12 Subdivision
Listing and Financial Details
- Assessor Parcel Number 006O A 03700 R0001633
Map
Create a Home Valuation Report for This Property
The Home Valuation Report is an in-depth analysis detailing your home's value as well as a comparison with similar homes in the area
Home Values in the Area
Average Home Value in this Area
Tax History
| Year | Tax Paid | Tax Assessment Tax Assessment Total Assessment is a certain percentage of the fair market value that is determined by local assessors to be the total taxable value of land and additions on the property. | Land | Improvement |
|---|---|---|---|---|
| 2025 | $1,757 | $72,825 | $13,750 | $59,075 |
| 2024 | $1,757 | $72,825 | $13,750 | $59,075 |
| 2023 | $1,358 | $72,375 | $13,750 | $58,625 |
| 2022 | $1,170 | $72,375 | $13,750 | $58,625 |
| 2021 | $1,064 | $47,925 | $10,000 | $37,925 |
| 2020 | $1,064 | $47,925 | $10,000 | $37,925 |
| 2019 | $1,064 | $47,925 | $10,000 | $37,925 |
| 2018 | $1,346 | $47,925 | $0 | $0 |
| 2017 | $1,173 | $32,325 | $0 | $0 |
| 2016 | $1,173 | $32,325 | $0 | $0 |
| 2015 | $1,181 | $32,325 | $0 | $0 |
| 2014 | $804 | $32,325 | $0 | $0 |
| 2013 | -- | $32,575 | $0 | $0 |
Source: Public Records
Purchase History
| Date | Type | Sale Price | Title Company |
|---|---|---|---|
| Deed | -- | -- | |
| Deed | $124,000 | -- | |
| Deed | $68,000 | -- | |
| Deed | $110,500 | -- | |
| Deed | $132,900 | -- | |
| Deed | $109,000 | -- |
Source: Public Records
Mortgage History
| Date | Status | Loan Amount | Loan Type |
|---|---|---|---|
| Previous Owner | $124,000 | No Value Available | |
| Previous Owner | $132,900 | No Value Available |
Source: Public Records
About the Listing Agent
I'm an expert real estate agent with Onward Real Estate in the Nashville, TN and surrounding areas, providing home-buyers and sellers with professional, responsive and attentive real estate services for 29 years. Buying or selling a home is the largest, most significant financial transaction people experience in their lifetime. Choosing the right Real Estate agent to represent you during this transaction is one of the most important decisions you will make. Providing excellent service and
Susan's Other Listings
Source: Realtracs
MLS Number: 3065167
APN: 006O-A-037.00-000
Disclaimer: Certain information contained herein is derived from information provided by parties other than Homes.com. All information provided is deemed reliable, but is not guaranteed to be accurate and should be independently verified.
![]() Based on information submitted to the MLS GRID. All data is obtained from various sources and may not have been verified by broker or MLS GRID. Supplied Open House Information is subject to change without notice. All information should be independently reviewed and verified for accuracy. Properties may or may not be listed by the office/agent presenting the information. Some IDX listings have been excluded from this website.
Based on information submitted to the MLS GRID. All data is obtained from various sources and may not have been verified by broker or MLS GRID. Supplied Open House Information is subject to change without notice. All information should be independently reviewed and verified for accuracy. Properties may or may not be listed by the office/agent presenting the information. Some IDX listings have been excluded from this website.
The Digital Millennium Copyright Act of 1998, 17 U.S.C. § 512 (the “DMCA”) provides recourse for copyright owners who believe that material appearing on the Internet infringes their rights under U.S. copyright law. If you believe in good faith that any content or material made available in connection with our website or services infringes your copyright, you (or your agent) may send us a notice requesting that the content or material be removed, or access to it blocked.
Notices must be sent in writing by email to DMCAnotice@MLSGrid.com.
The DMCA requires that your notice of alleged copyright infringement include the following information:
(1) description of the copyrighted work that is the subject of claimed infringement;
(2) description of the alleged infringing content and information sufficient to permit us to locate the content;
(3) contact information for you, including your address, telephone number and email address;
(4) a statement by you that you have a good faith belief that the content in the manner complained of is not authorized by the copyright owner, or its agent, or by the operation of any law;
(5) a statement by you, signed under penalty of perjury, that the information in the notification is accurate and that you have the authority to enforce the copyrights that are claimed to be infringed; and
(6) a physical or electronic signature of the copyright owner or a person authorized to act on the copyright owner’s behalf. Failure to include all of the above information may result in the delay of the processing of your complaint.
Nearby Homes
- 242 Lake Forest Dr
- 504 Holland Ridge Dr
- 120 Bill Stewart Blvd
- 175 Bill Stewart Blvd
- 800 Troy Cove
- 618 Cedar Bend Ln
- 603 Hollandale Rd
- 1529 Waxman Dr
- 605 Hollandale Rd
- 630 Holland Ridge Dr
- 1619 Jo Ann Dr
- 205 Clearlake Dr
- 221 Quiet Ln
- 603 E Lake Cove
- 101 Berele Shepsele Ln
- 396 Davids Way
- 1335 E Nir Shreibman Blvd
- 151 Ofner Dr
- 101 Kalman Minuskin Blvd
- 144 Ofner Dr
- 703 Lou Gehrig Cir
- 233 Lake Forest Dr
- 838 Carmen Way
- 306 Hank Aaron Cove
- 673 Mable Dr
- 141 Bill Stewart Blvd
- 849 Lavergne Ln
- 1202 Larzelere Ln
- 620 Cedar Bend Ln
- 913 Tom Hailey Blvd
- 1133 Phelissa Dr
- 626 Mable Dr
- 1137 Phelissa Dr
- 146 Howard Woody Dr
- 1230 Shannon Ln
- 610 Angel Way Ct
- 612 Mable Dr
- 176 Lyndhurst Dr
- 610 E Lake Cove
- 177 Howard Woody Dr