S
Landlord's Agent in 2025
Square Properties Inc
Square Properties, Inc.
(404) 250-4488
17 Total Sales
Estimated Value: $437,000 - $525,000
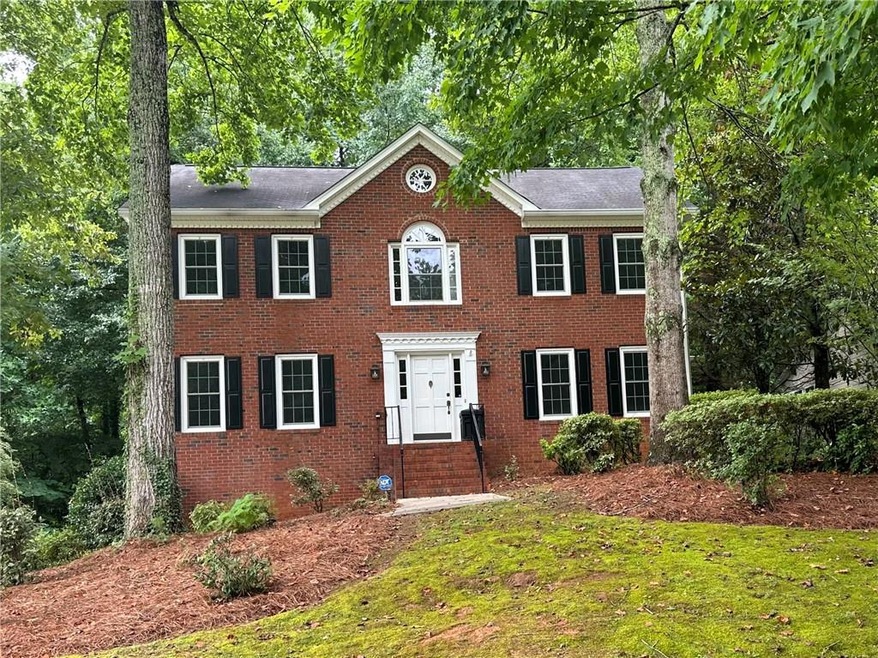
This beautifully maintained home is located in a highly sought-after neighborhood in the City of Marietta, just minutes away from the Historic Marietta Square, shopping centers, popular restaurants, and newly developed city parks. Enjoy outdoor activities at the nearby Kennesaw National Battlefield Park and scenic hiking trails. The home offers ample space for a home office, making remote work a breeze, and its location ensures a convenient commute throughout the metro Atlanta area. Recently updated with fresh paint, this home is move-in ready and waiting for you!
| Date | Buyer | Sale Price | Title Company |
|---|---|---|---|
| Rice Kyle | $285,000 | None Available | |
| Burmeister Shirley A | -- | -- |
| Date | Status | Borrower | Loan Amount |
|---|---|---|---|
| Open | Rice Kyle | $175,000 |
| Date | Event | Price | List to Sale | Price per Sq Ft | Prior Sale |
|---|---|---|---|---|---|
| 04/01/2025 04/01/25 | Rented | $2,500 | 0.0% | -- | |
| 02/25/2025 02/25/25 | Under Contract | -- | -- | -- | |
| 12/11/2024 12/11/24 | For Rent | $2,500 | 0.0% | -- | |
| 11/30/2024 11/30/24 | Off Market | $2,500 | -- | -- | |
| 10/11/2024 10/11/24 | Price Changed | $2,500 | -7.4% | $1 / Sq Ft | |
| 09/30/2024 09/30/24 | Price Changed | $2,700 | -5.3% | $1 / Sq Ft | |
| 09/10/2024 09/10/24 | Price Changed | $2,850 | -5.0% | $1 / Sq Ft | |
| 08/21/2024 08/21/24 | For Rent | $3,000 | +50.4% | -- | |
| 02/26/2021 02/26/21 | Rented | $1,995 | 0.0% | -- | |
| 02/17/2021 02/17/21 | Under Contract | -- | -- | -- | |
| 02/05/2021 02/05/21 | Price Changed | $1,995 | -5.0% | $1 / Sq Ft | |
| 01/14/2021 01/14/21 | Price Changed | $2,100 | -4.5% | $1 / Sq Ft | |
| 12/13/2020 12/13/20 | Price Changed | $2,200 | -4.3% | $1 / Sq Ft | |
| 11/27/2020 11/27/20 | Price Changed | $2,300 | -4.2% | $1 / Sq Ft | |
| 11/02/2020 11/02/20 | For Rent | $2,400 | 0.0% | -- | |
| 10/21/2020 10/21/20 | Sold | $285,000 | 0.0% | $131 / Sq Ft | View Prior Sale |
| 09/24/2020 09/24/20 | Pending | -- | -- | -- | |
| 09/17/2020 09/17/20 | For Sale | $285,000 | -- | $131 / Sq Ft |
| Year | Tax Paid | Tax Assessment Tax Assessment Total Assessment is a certain percentage of the fair market value that is determined by local assessors to be the total taxable value of land and additions on the property. | Land | Improvement |
|---|---|---|---|---|
| 2025 | $1,306 | $154,388 | $52,000 | $102,388 |
| 2024 | $1,306 | $154,388 | $52,000 | $102,388 |
| 2023 | $1,270 | $150,136 | $40,000 | $110,136 |
| 2022 | $927 | $109,560 | $32,000 | $77,560 |
| 2021 | $941 | $109,560 | $32,000 | $77,560 |
| 2020 | $495 | $100,724 | $32,000 | $68,724 |
| 2019 | $495 | $100,724 | $32,000 | $68,724 |
| 2018 | $493 | $83,400 | $28,000 | $55,400 |
| 2017 | $396 | $83,400 | $28,000 | $55,400 |
| 2016 | $395 | $67,796 | $19,200 | $48,596 |
| 2015 | $428 | $67,796 | $19,200 | $48,596 |
| 2014 | $439 | $67,796 | $0 | $0 |
S
Landlord's Agent in 2025
Square Properties Inc
Square Properties, Inc.
(404) 250-4488
17 Total Sales
B
Landlord's Co-Listing Agent in 2025
Brian Sundvik
Square Properties, Inc.
(770) 842-7707
17 Total Sales
M
Buyer's Agent in 2021
Mary Scarbrough
Hester Group REALTORS
(404) 640-0860
38 Total Sales

Seller's Agent in 2020
Annalee Dunkerly
Atlanta Communities
(404) 519-4683
41 Total Sales
Seller Co-Listing Agent in 2020
Dustin Dunkerly
Atlanta Communities
(678) 978-5955
21 Total Sales
Buyer's Agent in 2020
Ellen Carmack
Ansley Real Estate| Christie's International Real Estate
(770) 354-6799
5 in this area
60 Total Sales
Source: First Multiple Listing Service (FMLS)
MLS Number: 7442670
APN: 17-0068-0-070-0
Disclaimer: Certain information contained herein is derived from information provided by parties other than Homes.com. All information provided is deemed reliable, but is not guaranteed to be accurate and should be independently verified.
![]() Listings identified with the FMLS IDX logo come from FMLS and are held by brokerage firms other than the owner of this website. The listing brokerage is identified in any listing details. Information is deemed reliable but is not guaranteed. If you believe any FMLS listing contains material that infringes your copyrighted work please visit www.fmls.com/dmca to review our DMCA policy and learn how to submit a takedown request. © 2025 First Multiple Listing Service, Inc.
Listings identified with the FMLS IDX logo come from FMLS and are held by brokerage firms other than the owner of this website. The listing brokerage is identified in any listing details. Information is deemed reliable but is not guaranteed. If you believe any FMLS listing contains material that infringes your copyrighted work please visit www.fmls.com/dmca to review our DMCA policy and learn how to submit a takedown request. © 2025 First Multiple Listing Service, Inc.