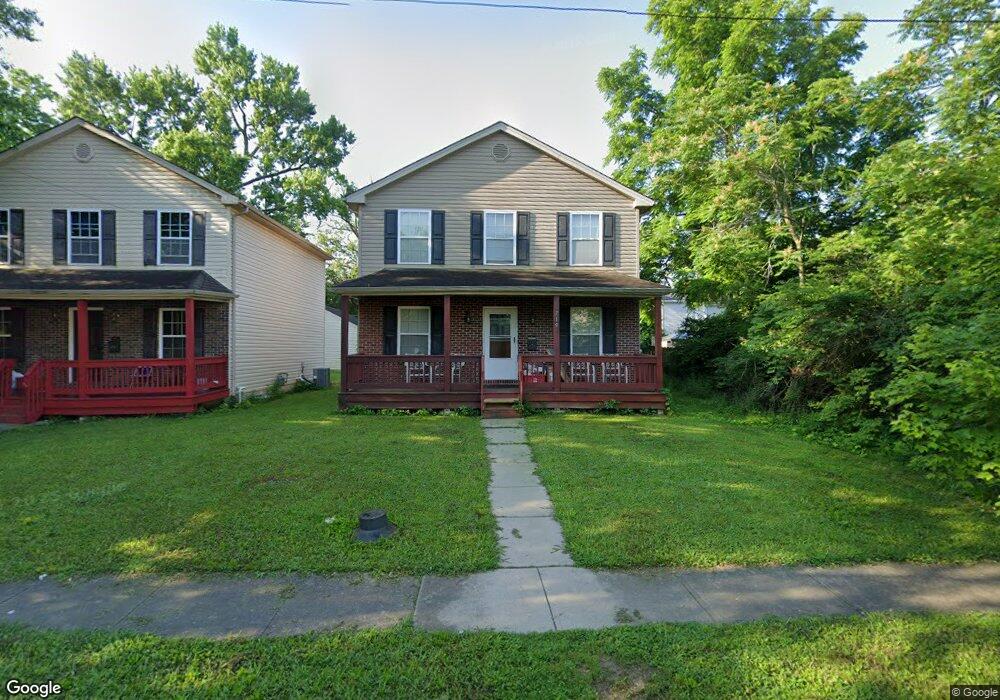
719 Maple St Wyoming, OH 45215
Estimated Value: $187,000 - $289,000
3
Beds
3
Baths
1,456
Sq Ft
$151/Sq Ft
Est. Value
About This Home
This home is located at 719 Maple St, Wyoming, OH 45215 and is currently estimated at $219,798, approximately $150 per square foot. 719 Maple St is a home located in Hamilton County with nearby schools including Lockland Elementary School, Lockland Middle School, and Lockland High School.
Ownership History
Date
Name
Owned For
Owner Type
Purchase Details
Closed on
May 7, 2011
Sold by
Cincinnati Housing Partners Inc
Bought by
Bah Aminata
Current Estimated Value
Home Financials for this Owner
Home Financials are based on the most recent Mortgage that was taken out on this home.
Original Mortgage
$78,780
Outstanding Balance
$53,633
Interest Rate
4.75%
Mortgage Type
FHA
Estimated Equity
$166,165
Purchase Details
Closed on
Mar 21, 2006
Sold by
Federal National Mortgage Association
Bought by
Cincinnati Housing Partners Inc
Purchase Details
Closed on
Mar 11, 2005
Sold by
Morgner Harold and Messenger Maritha
Bought by
Federal National Mortgage Association
Purchase Details
Closed on
Sep 30, 2002
Sold by
Morgner Harold and Messenger Maritha
Bought by
Mm Property Holdings Llc
Purchase Details
Closed on
Jul 21, 2002
Sold by
Stroud Anthony W
Bought by
Morganer Harold and Messenger Maritha
Create a Home Valuation Report for This Property
The Home Valuation Report is an in-depth analysis detailing your home's value as well as a comparison with similar homes in the area
Home Values in the Area
Average Home Value in this Area
Purchase History
| Date | Buyer | Sale Price | Title Company |
|---|---|---|---|
| Bah Aminata | $135,000 | None Available | |
| Cincinnati Housing Partners Inc | $8,700 | None Available | |
| Federal National Mortgage Association | $16,000 | None Available | |
| Mm Property Holdings Llc | -- | -- | |
| Morganer Harold | $70,000 | -- |
Source: Public Records
Mortgage History
| Date | Status | Borrower | Loan Amount |
|---|---|---|---|
| Open | Bah Aminata | $78,780 |
Source: Public Records
Tax History
| Year | Tax Paid | Tax Assessment Tax Assessment Total Assessment is a certain percentage of the fair market value that is determined by local assessors to be the total taxable value of land and additions on the property. | Land | Improvement |
|---|---|---|---|---|
| 2025 | $2,932 | $53,309 | $4,428 | $48,881 |
| 2023 | $1,592 | $53,309 | $4,428 | $48,881 |
| 2022 | $1,620 | $43,964 | $3,143 | $40,821 |
| 2021 | $1,610 | $43,964 | $3,143 | $40,821 |
| 2020 | $1,406 | $43,964 | $3,143 | $40,821 |
| 2019 | $1,502 | $43,964 | $3,143 | $40,821 |
| 2018 | $1,479 | $43,964 | $3,143 | $40,821 |
| 2017 | $1,389 | $43,964 | $3,143 | $40,821 |
| 2016 | $1,498 | $48,196 | $3,350 | $44,846 |
| 2015 | $1,408 | $48,196 | $3,350 | $44,846 |
| 2014 | $1,407 | $48,196 | $3,350 | $44,846 |
| 2013 | $1,345 | $47,250 | $3,283 | $43,967 |
Source: Public Records
Map
Nearby Homes
- 127 Locust St
- 701 W Wyoming Ave
- 1019 Crosley Ave
- 217 W Wyoming Ave
- 177 Burns Ave
- 1118 Burns Ave
- 405 Home Ave
- 342 Durrell Ave
- 519 Westview Ave
- 1076 Schumard Ave
- 334 Williams St
- 857 Steffen Ave
- 1239 Springfield Pike
- 320 Reily Rd
- 8421 Wiswell St
- 25 Euclid Ave
- 415 Arlington Ave
- 1282 Steffen Ave
- 329 Walnut St
- 42 Sheehan Ave
Your Personal Tour Guide
Ask me questions while you tour the home.