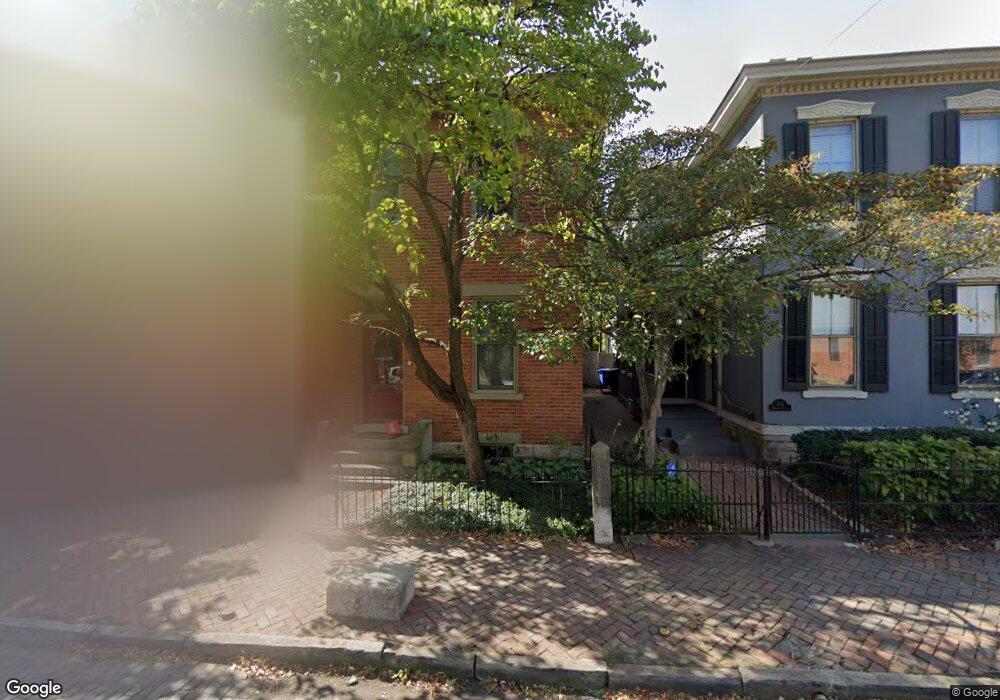
719 Mohawk St Columbus, OH 43206
German Village NeighborhoodEstimated Value: $605,751 - $775,000
2
Beds
3
Baths
1,440
Sq Ft
$495/Sq Ft
Est. Value
About This Home
This home is located at 719 Mohawk St, Columbus, OH 43206 and is currently estimated at $712,688, approximately $494 per square foot. 719 Mohawk St is a home located in Franklin County with nearby schools including Siebert Elementary School, South High School, and South Columbus Preparatory Academy.
Ownership History
Date
Name
Owned For
Owner Type
Purchase Details
Closed on
Sep 30, 2005
Sold by
Dimickele Doug L and Dimickele Susan M
Bought by
Costabile Lori A
Current Estimated Value
Home Financials for this Owner
Home Financials are based on the most recent Mortgage that was taken out on this home.
Original Mortgage
$304,000
Outstanding Balance
$163,432
Interest Rate
5.83%
Mortgage Type
Fannie Mae Freddie Mac
Estimated Equity
$549,256
Purchase Details
Closed on
Apr 3, 2003
Sold by
Esquivel Victor M and Esquivel Brenda
Bought by
Dimickele Doug L and Dimickele Susan M
Home Financials for this Owner
Home Financials are based on the most recent Mortgage that was taken out on this home.
Original Mortgage
$148,500
Interest Rate
5.71%
Mortgage Type
Purchase Money Mortgage
Purchase Details
Closed on
Jul 2, 2002
Sold by
Estate Of Clarence L Nunemaker
Bought by
Esquivel Victor M
Purchase Details
Closed on
Jun 12, 2002
Sold by
Estate Of Clarence L Nunemaker
Bought by
Esquivel Victor M
Purchase Details
Closed on
Jan 26, 1994
Bought by
Nunemaker Clarence L
Create a Home Valuation Report for This Property
The Home Valuation Report is an in-depth analysis detailing your home's value as well as a comparison with similar homes in the area
Home Values in the Area
Average Home Value in this Area
Purchase History
| Date | Buyer | Sale Price | Title Company |
|---|---|---|---|
| Costabile Lori A | $380,000 | Amerititle | |
| Dimickele Doug L | $165,000 | Chicago Title | |
| Esquivel Victor M | -- | -- | |
| Esquivel Victor M | -- | -- | |
| Nunemaker Clarence L | -- | -- |
Source: Public Records
Mortgage History
| Date | Status | Borrower | Loan Amount |
|---|---|---|---|
| Open | Costabile Lori A | $304,000 | |
| Previous Owner | Dimickele Doug L | $148,500 |
Source: Public Records
Tax History Compared to Growth
Tax History
| Year | Tax Paid | Tax Assessment Tax Assessment Total Assessment is a certain percentage of the fair market value that is determined by local assessors to be the total taxable value of land and additions on the property. | Land | Improvement |
|---|---|---|---|---|
| 2024 | $9,067 | $202,030 | $100,000 | $102,030 |
| 2023 | $8,951 | $202,020 | $99,995 | $102,025 |
| 2022 | $8,823 | $170,110 | $39,450 | $130,660 |
| 2021 | $8,838 | $170,110 | $39,450 | $130,660 |
| 2020 | $8,850 | $170,110 | $39,450 | $130,660 |
| 2019 | $9,007 | $148,470 | $34,300 | $114,170 |
| 2018 | $8,450 | $148,470 | $34,300 | $114,170 |
| 2017 | $8,858 | $148,470 | $34,300 | $114,170 |
| 2016 | $8,716 | $131,570 | $26,320 | $105,250 |
| 2015 | $7,912 | $131,570 | $26,320 | $105,250 |
| 2014 | $7,931 | $131,570 | $26,320 | $105,250 |
| 2013 | $3,725 | $125,300 | $25,060 | $100,240 |
Source: Public Records
Map
Nearby Homes
- 745 Mohawk St
- 133 E Sycamore St
- 783 Mohawk St
- 717 S 3rd St
- 688 S 5th St
- 649 S 5th St
- 46 E Frankfort St
- 606 Rader Alley
- 33 E Frankfort St
- 718 S 6th St
- 25 E Frankfort St
- 278 E Sycamore St
- 307 E Sycamore St
- 279-281 E Beck St
- 136 E Whittier St
- 842 S Pearl St
- 161 Jackson St
- 707 Sycamore Place Unit 707
- 582 S Pearl St Unit 582
- 639 S Grant Ave
- 729 Mohawk St
- 715 Mohawk St
- 711 Mohawk St
- 705 Mohawk St
- 138 E Frankfort St
- 0 S Lazelle St
- 720 S Lazelle St
- 703 Mohawk St
- 708 S Lazelle St
- 722 Mohawk St Unit 722
- 131 E Frankfort St
- 170 E Frankfort St
- 726 Mohawk St Unit 726
- 726 Mohawk St Unit 726
- 726 Mohawk St
- 726 Mohawk St Unit 170
- 726 Mohawk St Unit B
- 699 Mohawk St
- 730 Mohawk St
- 730 Mohawk St Unit 730