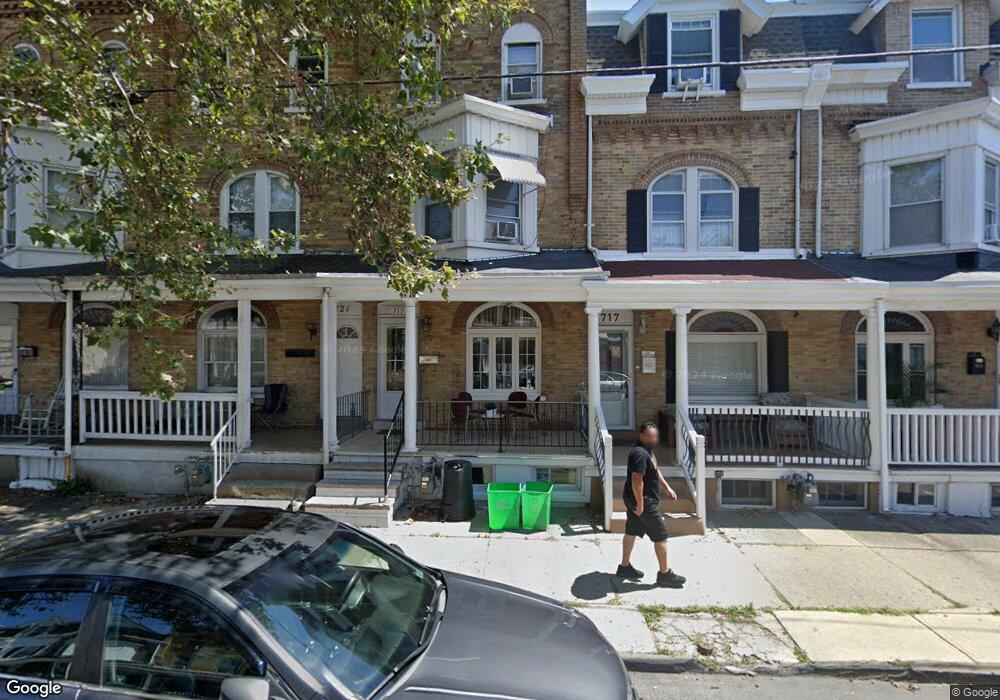
719 N 9th St Allentown, PA 18102
Center City NeighborhoodEstimated Value: $198,000 - $244,000
5
Beds
1
Bath
1,754
Sq Ft
$127/Sq Ft
Est. Value
About This Home
This home is located at 719 N 9th St, Allentown, PA 18102 and is currently estimated at $223,184, approximately $127 per square foot. 719 N 9th St is a home located in Lehigh County with nearby schools including Washington Elementary School, San Rafael Junior High School, and Trexler Middle School.
Ownership History
Date
Name
Owned For
Owner Type
Purchase Details
Closed on
Mar 19, 2004
Sold by
Zartler Mark A
Bought by
Carbucia Iris A
Current Estimated Value
Home Financials for this Owner
Home Financials are based on the most recent Mortgage that was taken out on this home.
Original Mortgage
$71,150
Outstanding Balance
$33,346
Interest Rate
5.71%
Mortgage Type
Purchase Money Mortgage
Estimated Equity
$189,838
Purchase Details
Closed on
Oct 10, 2003
Sold by
Emc Mortgage Corp
Bought by
Zartler Mark A
Purchase Details
Closed on
Aug 7, 2003
Sold by
Buggs Kennedy
Bought by
Emc Mortgage Corp
Purchase Details
Closed on
Sep 20, 2000
Sold by
U S Bank Trust Na
Bought by
New Again Properties Inc
Purchase Details
Closed on
Aug 4, 2000
Sold by
Mattos David J
Bought by
New Century Home Equity Loan Trust
Purchase Details
Closed on
Jun 26, 1998
Sold by
Troxel Patricia
Bought by
Mattos David J
Purchase Details
Closed on
Mar 28, 1997
Sold by
Ocwen Federal Bank Fsb
Bought by
Homecomings Financial Network Inc
Create a Home Valuation Report for This Property
The Home Valuation Report is an in-depth analysis detailing your home's value as well as a comparison with similar homes in the area
Home Values in the Area
Average Home Value in this Area
Purchase History
| Date | Buyer | Sale Price | Title Company |
|---|---|---|---|
| Carbucia Iris A | $74,900 | -- | |
| Zartler Mark A | $34,900 | -- | |
| Emc Mortgage Corp | -- | -- | |
| New Again Properties Inc | $14,000 | -- | |
| New Century Home Equity Loan Trust | -- | -- | |
| Mattos David J | $37,000 | -- | |
| Homecomings Financial Network Inc | $20,661 | -- |
Source: Public Records
Mortgage History
| Date | Status | Borrower | Loan Amount |
|---|---|---|---|
| Open | Carbucia Iris A | $71,150 |
Source: Public Records
Tax History Compared to Growth
Tax History
| Year | Tax Paid | Tax Assessment Tax Assessment Total Assessment is a certain percentage of the fair market value that is determined by local assessors to be the total taxable value of land and additions on the property. | Land | Improvement |
|---|---|---|---|---|
| 2025 | $2,394 | $74,700 | $4,600 | $70,100 |
| 2024 | $2,394 | $74,700 | $4,600 | $70,100 |
| 2023 | $2,394 | $74,700 | $4,600 | $70,100 |
| 2022 | $2,309 | $74,700 | $70,100 | $4,600 |
| 2021 | $2,262 | $74,700 | $4,600 | $70,100 |
| 2020 | $2,202 | $74,700 | $4,600 | $70,100 |
| 2019 | $2,166 | $74,700 | $4,600 | $70,100 |
| 2018 | $2,026 | $74,700 | $4,600 | $70,100 |
| 2017 | $1,974 | $74,700 | $4,600 | $70,100 |
| 2016 | -- | $74,700 | $4,600 | $70,100 |
| 2015 | -- | $74,700 | $4,600 | $70,100 |
| 2014 | -- | $74,700 | $4,600 | $70,100 |
Source: Public Records
Map
Nearby Homes
- 726 N Fountain St
- 823 W Tilghman St
- 739 N Hazel St
- 917 W Washington St
- 1010 W Tilghman St
- 746 N 10th St
- 816 W Allen St
- 622 N Silk St
- 612 N 10th St
- 516 N Lumber St
- 1038 W Green St
- 515 N Lumber St Unit 3
- 514 N Hazel St
- 719 N 11th St
- 719 1/2 N 11th St
- 753 W Cedar St
- 753 N 11th St
- 1042 W Allen St
- 513 N Howard St
- 737 W Liberty St