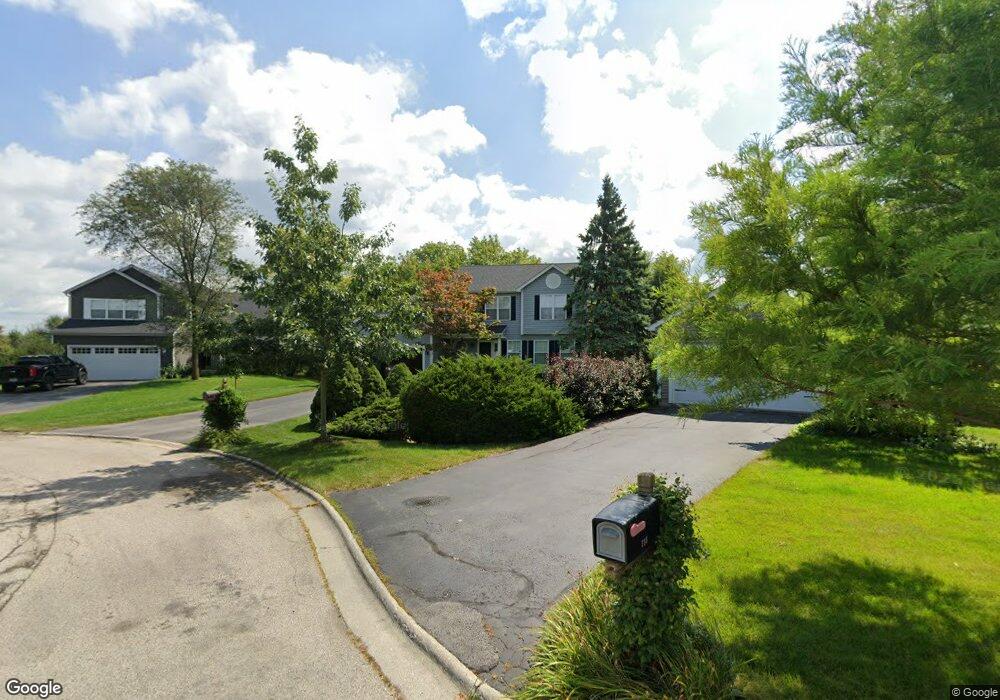
719 N Clover Ct Lindenhurst, IL 60046
Estimated Value: $443,000 - $482,000
4
Beds
4
Baths
2,150
Sq Ft
$212/Sq Ft
Est. Value
About This Home
This home is located at 719 N Clover Ct, Lindenhurst, IL 60046 and is currently estimated at $456,826, approximately $212 per square foot. 719 N Clover Ct is a home located in Lake County with nearby schools including Lakes Community High School.
Ownership History
Date
Name
Owned For
Owner Type
Purchase Details
Closed on
Dec 11, 2009
Sold by
Rockey Paul G and Rockey Jill
Bought by
Vavra Roberta S and Earll William A
Current Estimated Value
Home Financials for this Owner
Home Financials are based on the most recent Mortgage that was taken out on this home.
Original Mortgage
$239,112
Outstanding Balance
$155,963
Interest Rate
4.9%
Mortgage Type
FHA
Estimated Equity
$300,863
Purchase Details
Closed on
Sep 2, 2000
Sold by
Rockey Paul G and Rockey Linda L
Bought by
Rockey Paul G and Rockey Jill
Purchase Details
Closed on
Jun 8, 1998
Sold by
Grand Premier Trust & Investment Inc Na
Bought by
Rockey Paul G and Rockey Larry P
Home Financials for this Owner
Home Financials are based on the most recent Mortgage that was taken out on this home.
Original Mortgage
$130,000
Interest Rate
7.22%
Create a Home Valuation Report for This Property
The Home Valuation Report is an in-depth analysis detailing your home's value as well as a comparison with similar homes in the area
Home Values in the Area
Average Home Value in this Area
Purchase History
| Date | Buyer | Sale Price | Title Company |
|---|---|---|---|
| Vavra Roberta S | $255,000 | Ticor | |
| Rockey Paul G | -- | -- | |
| Rockey Paul G | $177,500 | Intercounty Title |
Source: Public Records
Mortgage History
| Date | Status | Borrower | Loan Amount |
|---|---|---|---|
| Open | Vavra Roberta S | $239,112 | |
| Previous Owner | Rockey Paul G | $130,000 |
Source: Public Records
Tax History Compared to Growth
Tax History
| Year | Tax Paid | Tax Assessment Tax Assessment Total Assessment is a certain percentage of the fair market value that is determined by local assessors to be the total taxable value of land and additions on the property. | Land | Improvement |
|---|---|---|---|---|
| 2024 | $10,493 | $124,686 | $20,446 | $104,240 |
| 2023 | $9,968 | $110,166 | $18,065 | $92,101 |
| 2022 | $9,968 | $98,120 | $12,150 | $85,970 |
| 2021 | $9,444 | $91,148 | $11,287 | $79,861 |
| 2020 | $9,811 | $88,227 | $10,925 | $77,302 |
| 2019 | $10,740 | $90,173 | $11,166 | $79,007 |
| 2018 | $10,747 | $93,386 | $16,158 | $77,228 |
| 2017 | $10,464 | $90,895 | $15,727 | $75,168 |
| 2016 | $10,689 | $87,214 | $15,090 | $72,124 |
| 2015 | $10,213 | $81,456 | $14,094 | $67,362 |
| 2014 | $8,857 | $74,487 | $14,160 | $60,327 |
| 2012 | $8,235 | $77,526 | $17,360 | $60,166 |
Source: Public Records
Map
Nearby Homes
- 691 N Autumn Cir
- 1896 E Vista Terrace
- 1847 Natures Ct
- 812 Auburn Ln
- 1820 Prairie Ridge Cir
- 527 Northgate Rd Unit 28
- 807 Wedgewood Ct
- 725 Porter Cir
- 1650 Natures Way
- 705 Porter Cir
- 724 Porter Cir
- 694 Monroe Dr
- 692 Monroe Dr
- 418 Surrey Ln
- 422 Northgate Rd
- 20215 W Miller Rd
- 420 Woodland Trail
- 433 Woodland Trail
- 437 Woodland Trail
- 428 Woodland Trail
- 715 N Clover Ct
- 725 N Clover Ct
- 709 N Clover Ct
- 729 N Clover Ct
- 735 N Clover Ct
- 705 N Clover Ct
- 724 N Clover Ct
- 720 N Clover Ct
- 734 N Clover Ct
- 730 N Clover Ct
- 716 N Clover Ct
- 721 N Summit Ct
- 692 N Autumn Cir
- 696 N Autumn Cir
- 1900 E Ivy Cir
- 723 N Summit Ct
- 719 N Summit Ct
- 1889 E Ivy Cir
- 684 N Autumn Cir
- 1879 E Ivy Cir