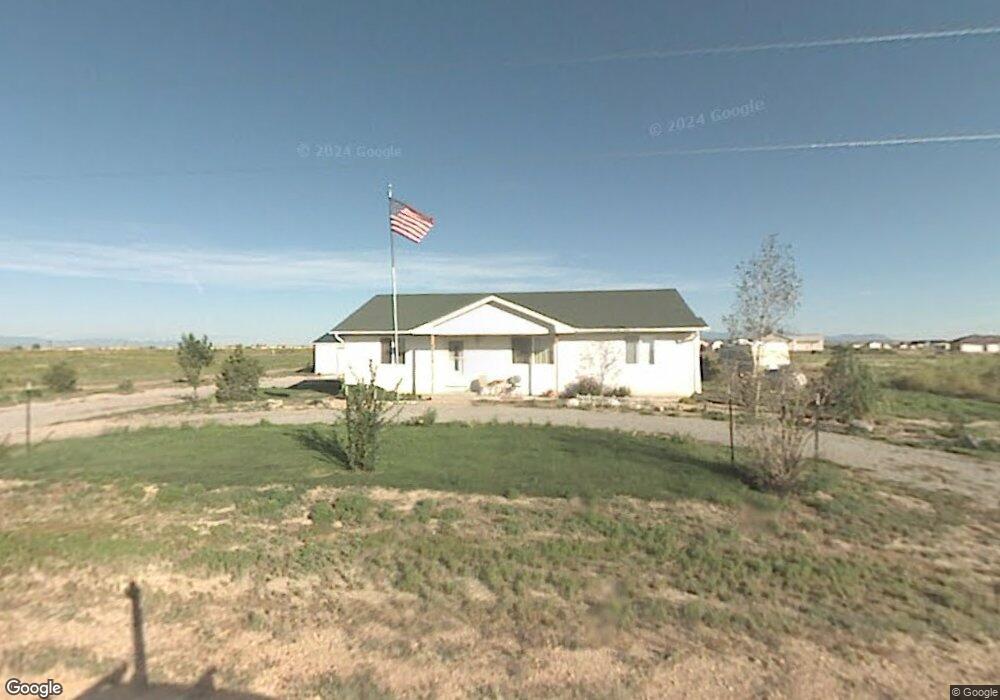
719 N Iliff Dr Unit 3 Pueblo, CO 81007
Estimated Value: $359,874 - $376,000
3
Beds
2
Baths
1,368
Sq Ft
$269/Sq Ft
Est. Value
About This Home
This home is located at 719 N Iliff Dr Unit 3, Pueblo, CO 81007 and is currently estimated at $367,719, approximately $268 per square foot. 719 N Iliff Dr Unit 3 is a home located in Pueblo County with nearby schools including Prairie Winds Elementary School, Liberty Point International School, and Pueblo West High School.
Ownership History
Date
Name
Owned For
Owner Type
Purchase Details
Closed on
Aug 16, 2021
Sold by
Frontenot Lisa R
Bought by
Krey Loren
Current Estimated Value
Home Financials for this Owner
Home Financials are based on the most recent Mortgage that was taken out on this home.
Original Mortgage
$347,820
Outstanding Balance
$316,276
Interest Rate
2.9%
Mortgage Type
VA
Estimated Equity
$51,443
Purchase Details
Closed on
Mar 29, 2012
Sold by
Aragon Miguel
Bought by
Fontenot Lisa R
Home Financials for this Owner
Home Financials are based on the most recent Mortgage that was taken out on this home.
Original Mortgage
$124,267
Interest Rate
3.91%
Mortgage Type
FHA
Purchase Details
Closed on
Apr 8, 2005
Sold by
Phillips James E and Phillips Elizabeth G
Bought by
Aragon Miguel
Home Financials for this Owner
Home Financials are based on the most recent Mortgage that was taken out on this home.
Original Mortgage
$118,500
Interest Rate
5.75%
Mortgage Type
Fannie Mae Freddie Mac
Create a Home Valuation Report for This Property
The Home Valuation Report is an in-depth analysis detailing your home's value as well as a comparison with similar homes in the area
Home Values in the Area
Average Home Value in this Area
Purchase History
| Date | Buyer | Sale Price | Title Company |
|---|---|---|---|
| Krey Loren | $340,000 | Land Title Guarantee | |
| Fontenot Lisa R | $127,500 | Stewart Title | |
| Aragon Miguel | $118,500 | Lawyers Title |
Source: Public Records
Mortgage History
| Date | Status | Borrower | Loan Amount |
|---|---|---|---|
| Open | Krey Loren | $347,820 | |
| Previous Owner | Fontenot Lisa R | $124,267 | |
| Previous Owner | Aragon Miguel | $118,500 |
Source: Public Records
Tax History Compared to Growth
Tax History
| Year | Tax Paid | Tax Assessment Tax Assessment Total Assessment is a certain percentage of the fair market value that is determined by local assessors to be the total taxable value of land and additions on the property. | Land | Improvement |
|---|---|---|---|---|
| 2024 | $1,741 | $17,340 | -- | -- |
| 2023 | $1,761 | $21,020 | $3,580 | $17,440 |
| 2022 | $1,575 | $15,700 | $2,330 | $13,370 |
| 2021 | $1,616 | $16,160 | $2,400 | $13,760 |
| 2020 | $1,325 | $16,160 | $2,400 | $13,760 |
| 2019 | $1,321 | $13,218 | $965 | $12,253 |
| 2018 | $1,162 | $11,620 | $540 | $11,080 |
| 2017 | $1,163 | $11,620 | $540 | $11,080 |
| 2016 | $1,085 | $10,858 | $637 | $10,221 |
| 2015 | $1,076 | $10,858 | $637 | $10,221 |
| 2014 | $1,000 | $10,086 | $756 | $9,330 |
Source: Public Records
Map
Nearby Homes
- 923 E Platteville Blvd
- 633 N Iliff Dr
- 977 E Sumac Dr
- 688 Maplelawn Dr
- 803 N Ravencliff Dr
- 729 Mapleleaf Dr
- 806 N Monarch Dr
- 893 E Platteville Blvd
- 292 N Purcell Blvd
- 1309 E Jaroso Dr
- 1045 E Jaroso Dr
- 866 E Snyder Dr
- 773 Wendover Dr
- 562 N Mancos Dr
- 574 N Canvas Dr
- 559 N Iliff Dr
- 902 E Platteville Blvd
- 869 E Platteville Blvd
- 765 E Platteville Blvd
- 671 N Snyder Dr
- 719 N Iliff Dr
- 726 N Iliff Dr
- 1011 E Platteville Blvd
- 738 N Iliff Dr
- 738 N Iliff Dr Unit 9
- 733 N Iliff Dr
- 1040 E Longsdale Dr
- 0 N Purcell Blvd Unit 3 90447
- 0 N Purcell Blvd Unit 15,1 84981
- 0 N Purcell Blvd Unit 1 54153
- 0 N Purcell Blvd Unit 111240
- 0 N Purcell Blvd Unit 111512
- 0 N Purcell Blvd Unit 92899
- 0 N Purcell Blvd Unit 12 92598
- 0 N Purcell Blvd Unit 122018
- 0 N Purcell Blvd
- 695 N Iliff Dr
- 1073 E Platteville Blvd
- 1032 E Longsdale Dr