Estimated Value: $281,000 - $326,000
3
Beds
2
Baths
1,107
Sq Ft
$272/Sq Ft
Est. Value
About This Home
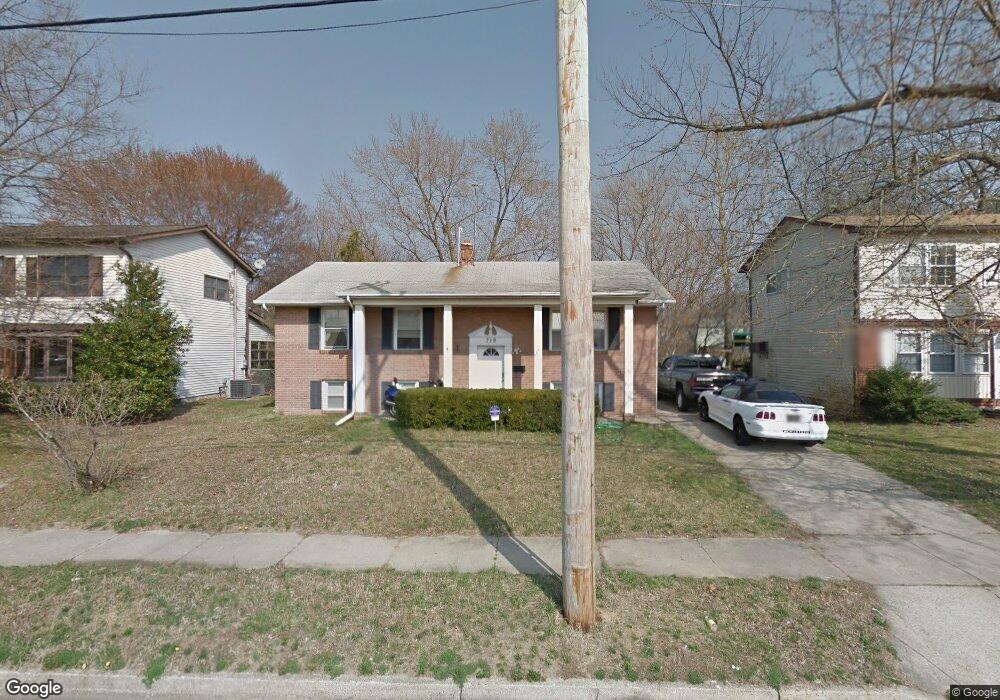
This home is located at 719 Pear St, Dover, DE 19904 and is currently estimated at $301,535, approximately $272 per square foot. 719 Pear St is a home located in Kent County with nearby schools including Fairview Elementary School, William Henry Middle School, and Central Middle School.
Ownership History
Date
Name
Owned For
Owner Type
Purchase Details
Closed on
May 18, 2006
Sold by
F S Investors Llc
Bought by
Goodball Osborne E and Goodball Pamela
Current Estimated Value
Home Financials for this Owner
Home Financials are based on the most recent Mortgage that was taken out on this home.
Original Mortgage
$214,515
Outstanding Balance
$125,301
Interest Rate
6.55%
Mortgage Type
VA
Estimated Equity
$176,234
Purchase Details
Closed on
Oct 31, 2005
Sold by
Brown William P and Brown Ingeborg E
Bought by
F S Investors Llc
Home Financials for this Owner
Home Financials are based on the most recent Mortgage that was taken out on this home.
Original Mortgage
$100,000
Interest Rate
5.93%
Mortgage Type
Future Advance Clause Open End Mortgage
Create a Home Valuation Report for This Property
The Home Valuation Report is an in-depth analysis detailing your home's value as well as a comparison with similar homes in the area
Home Values in the Area
Average Home Value in this Area
Purchase History
| Date | Buyer | Sale Price | Title Company |
|---|---|---|---|
| Goodball Osborne E | $3,150 | None Available | |
| F S Investors Llc | $1,050 | None Available |
Source: Public Records
Mortgage History
| Date | Status | Borrower | Loan Amount |
|---|---|---|---|
| Open | Goodball Osborne E | $214,515 | |
| Previous Owner | F S Investors Llc | $100,000 |
Source: Public Records
Tax History
| Year | Tax Paid | Tax Assessment Tax Assessment Total Assessment is a certain percentage of the fair market value that is determined by local assessors to be the total taxable value of land and additions on the property. | Land | Improvement |
|---|---|---|---|---|
| 2025 | $1,484 | $252,500 | $85,500 | $167,000 |
| 2024 | $1,433 | $252,500 | $85,500 | $167,000 |
| 2023 | $986 | $33,500 | $7,100 | $26,400 |
| 2022 | $953 | $33,500 | $7,100 | $26,400 |
| 2021 | $918 | $33,500 | $7,100 | $26,400 |
| 2020 | $887 | $33,500 | $7,100 | $26,400 |
| 2019 | $839 | $33,500 | $7,100 | $26,400 |
| 2018 | $765 | $33,500 | $7,100 | $26,400 |
| 2017 | $753 | $33,500 | $0 | $0 |
| 2016 | $755 | $33,500 | $0 | $0 |
| 2015 | $755 | $33,500 | $0 | $0 |
| 2014 | $757 | $33,500 | $0 | $0 |
Source: Public Records
Map
Nearby Homes
- 721 N West St
- 605 Columbia Ave
- 527 William St
- 910 Wilson Dr
- 910 Schoolhouse Ln
- 328 N Bradford St
- 335 N Bradford St
- 209 N New St
- 52 Eiger Ct
- 118 N Queen St
- 130 N Queen St
- 668 Vista Ave
- 224 N State St
- 8 Ironwood Cir
- 78 Washington St
- 57 Chatham Ct
- 59 Chatham Ct
- 68 Forest Creek Dr
- 400 College Rd
- 30 N Governors Ave
Your Personal Tour Guide
Ask me questions while you tour the home.