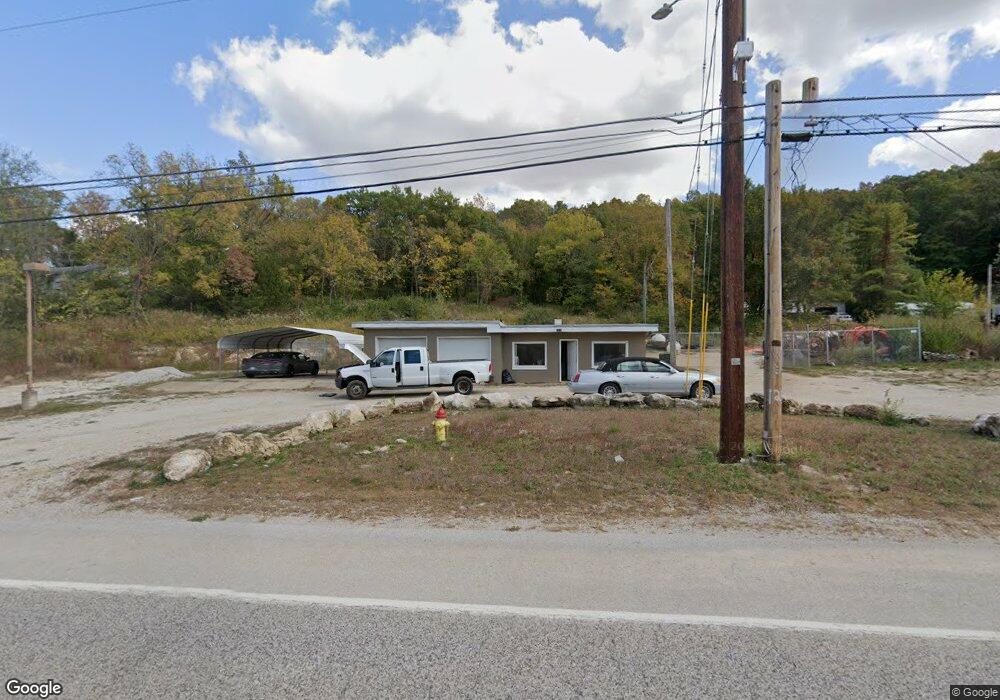
7190 Us Highway 61/67 Barnhart, MO 63012
Estimated Value: $165,788
--
Bed
1
Bath
1,104
Sq Ft
$150/Sq Ft
Est. Value
About This Home
This home is located at 7190 Us Highway 61/67, Barnhart, MO 63012 and is currently estimated at $165,788, approximately $150 per square foot. 7190 Us Highway 61/67 is a home located in Jefferson County with nearby schools including Windsor High School and St. Joseph Catholic School.
Ownership History
Date
Name
Owned For
Owner Type
Purchase Details
Closed on
Nov 21, 2019
Sold by
Subterra Technologies Inc
Bought by
Stevenson Kurt David and Kurt David Stevenson Revcoable Inter Viv
Current Estimated Value
Purchase Details
Closed on
May 30, 2019
Sold by
Mciver Judy Fay and Mciver Carey
Bought by
Subterra Technologies Inc
Home Financials for this Owner
Home Financials are based on the most recent Mortgage that was taken out on this home.
Original Mortgage
$80,000
Interest Rate
4.1%
Mortgage Type
Commercial
Purchase Details
Closed on
Dec 22, 2009
Sold by
Mciver Dale Leroy
Bought by
Mciver Dale Leroy and Mciver Judy Fay
Purchase Details
Closed on
Dec 14, 2000
Sold by
Thomas Glenn M and Thomas Genevieve C
Bought by
Mciver Carey and Mciver Stacey
Home Financials for this Owner
Home Financials are based on the most recent Mortgage that was taken out on this home.
Original Mortgage
$60,000
Interest Rate
7.72%
Mortgage Type
Commercial
Create a Home Valuation Report for This Property
The Home Valuation Report is an in-depth analysis detailing your home's value as well as a comparison with similar homes in the area
Home Values in the Area
Average Home Value in this Area
Purchase History
| Date | Buyer | Sale Price | Title Company |
|---|---|---|---|
| Stevenson Kurt David | -- | None Available | |
| Subterra Technologies Inc | -- | None Available | |
| Mciver Dale Leroy | -- | None Available | |
| Mciver Carey | -- | -- |
Source: Public Records
Mortgage History
| Date | Status | Borrower | Loan Amount |
|---|---|---|---|
| Previous Owner | Subterra Technologies Inc | $80,000 | |
| Previous Owner | Mciver Carey | $60,000 |
Source: Public Records
Tax History Compared to Growth
Tax History
| Year | Tax Paid | Tax Assessment Tax Assessment Total Assessment is a certain percentage of the fair market value that is determined by local assessors to be the total taxable value of land and additions on the property. | Land | Improvement |
|---|---|---|---|---|
| 2025 | $1,870 | $26,100 | $19,100 | $7,000 |
| 2024 | $1,870 | $23,700 | $19,100 | $4,600 |
| 2023 | $1,870 | $23,700 | $19,100 | $4,600 |
| 2022 | $1,857 | $23,700 | $19,100 | $4,600 |
| 2021 | $1,859 | $23,700 | $19,100 | $4,600 |
| 2020 | $1,891 | $23,700 | $19,100 | $4,600 |
| 2019 | $1,896 | $23,700 | $19,100 | $4,600 |
| 2018 | $1,716 | $21,700 | $17,700 | $4,000 |
| 2017 | $1,656 | $21,700 | $17,700 | $4,000 |
| 2016 | $1,547 | $21,700 | $17,700 | $4,000 |
| 2015 | $1,545 | $21,700 | $17,700 | $4,000 |
| 2013 | -- | $21,700 | $17,700 | $4,000 |
Source: Public Records
Map
Nearby Homes
- 7098 Ridge Dr
- 7062 Tuckahoe Ct
- 7075 Metropolitan Blvd
- 7255 Meriwether Ct
- 7056 Albermarle Ct
- 7009 Albermarle Ct
- 1728 Fairfax Dr
- 7013 Wayles Dr
- 1670 Clover Ct
- 1022 Graystone Park
- 6788 Haven Hill Rd
- 6555 Pauline Ct
- 6 Huntleigh Woods
- 0 Hwy Mm Unit MAR24032005
- 6625 Dry Creek Rd
- 0 Highland Terrace
- 1675 Old State Road M
- 2030 Engle Ridge Rd
- 2090 Birchwood Dr
- 900 Bluff Rd
- 7190 Us Highway 61 67
- 7180 Us Highway 61/67
- 7236 Us Highway 61/67
- 7242 Us Highway 61 67
- 7140 Valley Dr
- 7138 Valley Dr
- 7186 Us Highway 61/67
- 7172 Valley Dr
- 7116 Us Highway 61-67
- 7160 Valley Dr
- 1470 Douglas Dr
- 7150 Valley Dr
- 7132 Valley Dr
- 1447 Sproule Dr
- 7120 Valley Dr
- 7196 Valley Dr
- 7128 Valley Dr
- 0TBB Bradford @ Moss Hollow
- 7151 Valley Dr
- 7200 Valley Dr