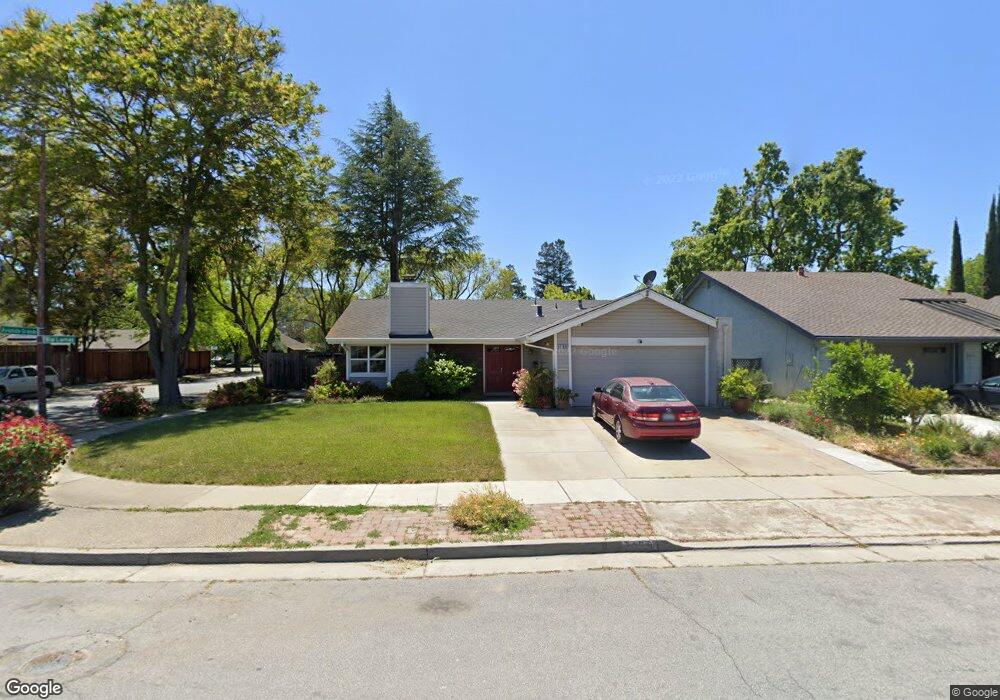
7199 Via Lomas San Jose, CA 95139
Los Paseos NeighborhoodEstimated Value: $1,259,690 - $1,432,000
3
Beds
2
Baths
1,308
Sq Ft
$1,044/Sq Ft
Est. Value
About This Home
This home is located at 7199 Via Lomas, San Jose, CA 95139 and is currently estimated at $1,364,923, approximately $1,043 per square foot. 7199 Via Lomas is a home located in Santa Clara County with nearby schools including Los Paseos Elementary School, Martin Murphy Middle School, and Ann Sobrato High School.
Ownership History
Date
Name
Owned For
Owner Type
Purchase Details
Closed on
Sep 29, 2007
Sold by
Allred Wallace N and Allred Dai
Bought by
Allred Wallace Newton and Allred Dai Yang
Current Estimated Value
Purchase Details
Closed on
Apr 10, 2002
Sold by
Allred Wallace N
Bought by
Allred Wallace N and Allred Dai
Home Financials for this Owner
Home Financials are based on the most recent Mortgage that was taken out on this home.
Original Mortgage
$309,000
Interest Rate
6.78%
Purchase Details
Closed on
Feb 16, 2001
Sold by
Allred Tanya A
Bought by
Allred Wallace N
Home Financials for this Owner
Home Financials are based on the most recent Mortgage that was taken out on this home.
Original Mortgage
$307,500
Interest Rate
7.37%
Create a Home Valuation Report for This Property
The Home Valuation Report is an in-depth analysis detailing your home's value as well as a comparison with similar homes in the area
Home Values in the Area
Average Home Value in this Area
Purchase History
| Date | Buyer | Sale Price | Title Company |
|---|---|---|---|
| Allred Wallace Newton | -- | None Available | |
| Allred Wallace N | -- | Chicago Title Co | |
| Allred Wallace N | -- | First American Title Guarant | |
| Allred Wallace N | -- | First American Title Guarant |
Source: Public Records
Mortgage History
| Date | Status | Borrower | Loan Amount |
|---|---|---|---|
| Closed | Allred Wallace N | $309,000 | |
| Closed | Allred Wallace N | $307,500 |
Source: Public Records
Tax History Compared to Growth
Tax History
| Year | Tax Paid | Tax Assessment Tax Assessment Total Assessment is a certain percentage of the fair market value that is determined by local assessors to be the total taxable value of land and additions on the property. | Land | Improvement |
|---|---|---|---|---|
| 2025 | $2,479 | $86,799 | $24,454 | $62,345 |
| 2024 | $2,479 | $85,098 | $23,975 | $61,123 |
| 2023 | $2,388 | $83,430 | $23,505 | $59,925 |
| 2022 | $2,357 | $81,795 | $23,045 | $58,750 |
| 2021 | $2,239 | $80,193 | $22,594 | $57,599 |
| 2020 | $2,129 | $79,372 | $22,363 | $57,009 |
| 2019 | $2,097 | $77,817 | $21,925 | $55,892 |
| 2018 | $2,053 | $76,293 | $21,496 | $54,797 |
| 2017 | $2,016 | $74,798 | $21,075 | $53,723 |
| 2016 | $1,906 | $73,332 | $20,662 | $52,670 |
| 2015 | $1,863 | $72,231 | $20,352 | $51,879 |
| 2014 | $1,469 | $70,817 | $19,954 | $50,863 |
Source: Public Records
Map
Nearby Homes
- 7392 Tulare Hill Dr
- 45 Cheltenham Way
- 6986 Gregorich Dr Unit C
- 7270 Alder Spring Way
- 133 Cheltenham Way
- 6945 Rodling Dr Unit C
- 6958 Gregorich Dr Unit G
- 7189 Rosencrans Way
- 6130 Monterey Rd Unit 201
- 6130 Monterey Rd Unit 289
- 6130 Monterey Rd Unit 9
- 6130 Monterey Rd Unit 159
- 6130 Monterey Rd Unit 316
- 202 French Ct
- 6901 Rodling Dr Unit D
- 219 Fairway Glen Ln
- 7237 Longhill Way
- 7260 Clear Vista Ct
- 227 Martinvale Ln
- 1083 Esparanza Way