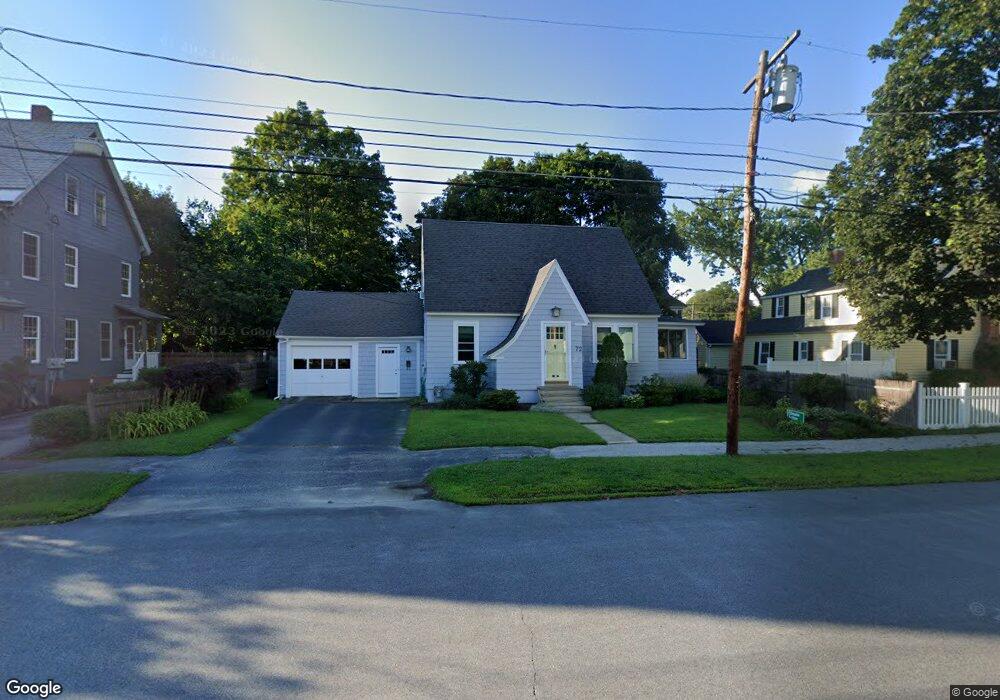
72 Allison St Concord, NH 03301
South End NeighborhoodEstimated Value: $423,684 - $491,000
2
Beds
2
Baths
1,236
Sq Ft
$370/Sq Ft
Est. Value
About This Home
This home is located at 72 Allison St, Concord, NH 03301 and is currently estimated at $457,421, approximately $370 per square foot. 72 Allison St is a home located in Merrimack County with nearby schools including Abbot-Downing School, Rundlett Middle School, and Concord High School.
Ownership History
Date
Name
Owned For
Owner Type
Purchase Details
Closed on
Nov 4, 2003
Sold by
Wilson John R
Bought by
Dunn Gerald F
Current Estimated Value
Home Financials for this Owner
Home Financials are based on the most recent Mortgage that was taken out on this home.
Original Mortgage
$186,400
Interest Rate
6.05%
Mortgage Type
Purchase Money Mortgage
Create a Home Valuation Report for This Property
The Home Valuation Report is an in-depth analysis detailing your home's value as well as a comparison with similar homes in the area
Home Values in the Area
Average Home Value in this Area
Purchase History
| Date | Buyer | Sale Price | Title Company |
|---|---|---|---|
| Dunn Gerald F | $233,000 | -- |
Source: Public Records
Mortgage History
| Date | Status | Borrower | Loan Amount |
|---|---|---|---|
| Open | Dunn Gerald F | $125,548 | |
| Closed | Dunn Gerald F | $152,000 | |
| Closed | Dunn Gerald F | $186,400 |
Source: Public Records
Tax History Compared to Growth
Tax History
| Year | Tax Paid | Tax Assessment Tax Assessment Total Assessment is a certain percentage of the fair market value that is determined by local assessors to be the total taxable value of land and additions on the property. | Land | Improvement |
|---|---|---|---|---|
| 2024 | $7,692 | $277,800 | $108,400 | $169,400 |
| 2023 | $7,462 | $277,800 | $108,400 | $169,400 |
| 2022 | $7,192 | $277,800 | $108,400 | $169,400 |
| 2021 | $6,936 | $276,100 | $108,400 | $167,700 |
| 2020 | $6,671 | $249,300 | $86,600 | $162,700 |
| 2019 | $6,089 | $219,200 | $84,900 | $134,300 |
| 2018 | $5,926 | $210,200 | $84,900 | $125,300 |
| 2017 | $5,775 | $204,500 | $84,900 | $119,600 |
| 2016 | $5,440 | $196,600 | $83,300 | $113,300 |
| 2015 | $5,197 | $188,300 | $86,900 | $101,400 |
| 2014 | $5,048 | $188,300 | $86,900 | $101,400 |
| 2013 | -- | $186,300 | $86,900 | $99,400 |
| 2012 | -- | $183,300 | $86,900 | $96,400 |
Source: Public Records
Map
Nearby Homes
- 122 South St
- 12 Avon St
- 0 Spruce St Unit 88
- 33 Spruce St
- 105 S Main St
- 0 South St Unit 4969509
- 24 Pierce St
- 47 South St
- 14 Downing St
- 14-16 Perley St
- 10 Perley St
- 15 Wilson Ave
- 22 Wilson Ave
- 87 S Main St Unit 2
- 4 Fayette St
- 376 S Main St
- 54 Pleasant St Unit 8
- 2 Kensington Rd
- 289 South St
- 1 Kensington Rd