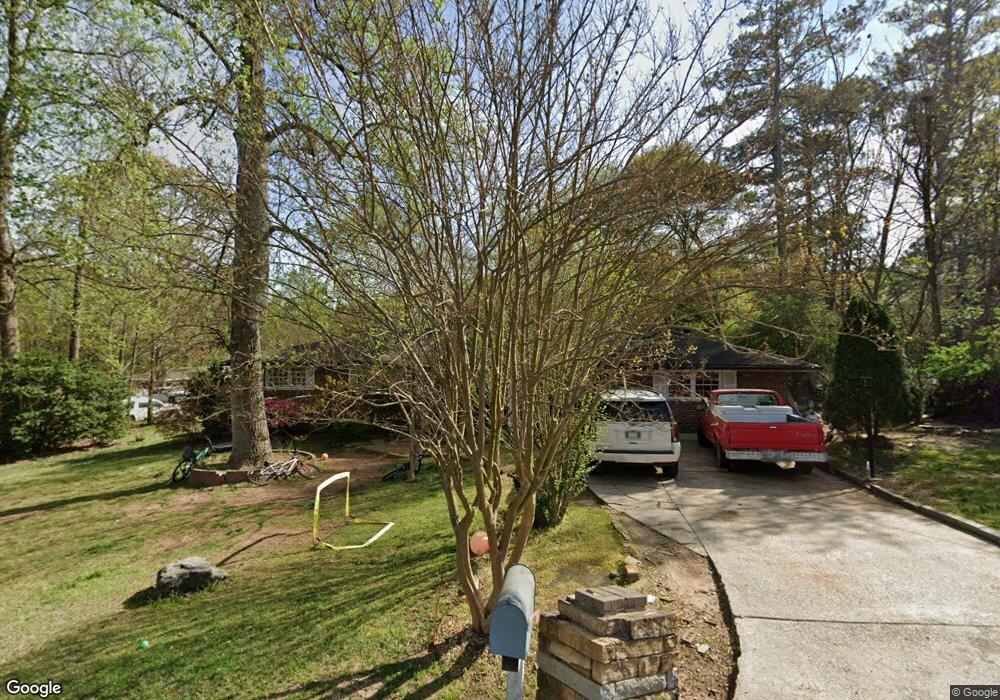
72 Barrett Cir SE Marietta, GA 30060
Southwestern Marietta NeighborhoodEstimated Value: $283,000 - $377,000
3
Beds
2
Baths
1,934
Sq Ft
$172/Sq Ft
Est. Value
About This Home
This home is located at 72 Barrett Cir SE, Marietta, GA 30060 and is currently estimated at $333,468, approximately $172 per square foot. 72 Barrett Cir SE is a home located in Cobb County with nearby schools including LaBelle Elementary School, Griffin Middle School, and Campbell High School.
Ownership History
Date
Name
Owned For
Owner Type
Purchase Details
Closed on
Feb 3, 2021
Sold by
Mendiola Magdalena
Bought by
Mendiola Jose A and Fernandez Judith A
Current Estimated Value
Purchase Details
Closed on
Mar 7, 2007
Sold by
Fedl Natl Mtg Assoc
Bought by
Mendiola Magdalena
Home Financials for this Owner
Home Financials are based on the most recent Mortgage that was taken out on this home.
Original Mortgage
$124,000
Outstanding Balance
$74,847
Interest Rate
6.3%
Mortgage Type
New Conventional
Estimated Equity
$258,621
Purchase Details
Closed on
Nov 7, 2006
Sold by
Bank Of America Na
Bought by
Federal National Mortgage Association
Purchase Details
Closed on
May 25, 2005
Sold by
Wilson Charles L and Wilson Elzabeth
Bought by
Mora Rosa E
Home Financials for this Owner
Home Financials are based on the most recent Mortgage that was taken out on this home.
Original Mortgage
$137,000
Interest Rate
5.74%
Mortgage Type
New Conventional
Create a Home Valuation Report for This Property
The Home Valuation Report is an in-depth analysis detailing your home's value as well as a comparison with similar homes in the area
Home Values in the Area
Average Home Value in this Area
Purchase History
| Date | Buyer | Sale Price | Title Company |
|---|---|---|---|
| Mendiola Jose A | -- | None Available | |
| Mendiola Magdalena | -- | -- | |
| Federal National Mortgage Association | -- | -- | |
| Bank Of America Na | $113,909 | -- | |
| Mora Rosa E | $137,000 | -- |
Source: Public Records
Mortgage History
| Date | Status | Borrower | Loan Amount |
|---|---|---|---|
| Open | Mendiola Magdalena | $124,000 | |
| Previous Owner | Mora Rosa E | $137,000 |
Source: Public Records
Tax History Compared to Growth
Tax History
| Year | Tax Paid | Tax Assessment Tax Assessment Total Assessment is a certain percentage of the fair market value that is determined by local assessors to be the total taxable value of land and additions on the property. | Land | Improvement |
|---|---|---|---|---|
| 2025 | $4,923 | $163,396 | $32,000 | $131,396 |
| 2024 | $5,451 | $180,804 | $24,000 | $156,804 |
| 2023 | $2,796 | $92,732 | $16,000 | $76,732 |
| 2022 | $2,814 | $92,732 | $16,000 | $76,732 |
| 2021 | $2,814 | $92,732 | $16,000 | $76,732 |
| 2020 | $1,933 | $63,692 | $16,000 | $47,692 |
| 2019 | $2,039 | $67,176 | $14,000 | $53,176 |
| 2018 | $1,758 | $57,920 | $14,000 | $43,920 |
| 2017 | $1,340 | $46,600 | $10,000 | $36,600 |
| 2016 | $1,187 | $41,272 | $8,000 | $33,272 |
| 2015 | $865 | $29,356 | $6,000 | $23,356 |
| 2014 | $872 | $29,356 | $0 | $0 |
Source: Public Records
Map
Nearby Homes
- 85 Smyrna Powder Springs Rd SE
- 2379 Olive Springs Rd SE
- 33 Smyrna Powder Springs Rd SE
- 285 Windy Hill Rd SE
- 51 Overbrook Dr SE Unit 3
- 1007 Chateau Ln SE
- 2041 White Cypress Ct
- 2675 Sandtown Rd SW
- 355 Benson Manor Cir SE
- 235 Still Pine Bend
- 119 Still Pine Bend
- 244 Timber Creek Ln SW
- 2245 Panstone Dr SW
- 264 Rockin Hill Dr SW
- 174 Timber Creek Ln SW Unit 176
- 166 Zelma St SW
- 2896 Lakemont Dr SW
- 2898 Lakemont Dr SW
- 64 Barrett Cir SE
- 69 Barrett Cir SE
- 77 Barrett Cir SE
- 117 Barrett Cir SE
- 58 Barrett Cir SE
- 75 Dewey Ln SE
- 107 Barrett Cir SE
- 61 Barrett Cir SE
- 67 Dewey Ln SE
- 127 Barrett Cir SE
- 0 Barrett Cir SE Unit 7489656
- 0 Barrett Cir SE Unit 8441148
- 0 Barrett Cir SE Unit 8363033
- 50 Barrett Cir SE
- 59 Dewey Ln SE
- 97 Barrett Cir SE
- 137 Barrett Cir SE
- 51 Barrett Cir SE
- 51 Dewey Ln SE
- 43 Dewey Ln SE