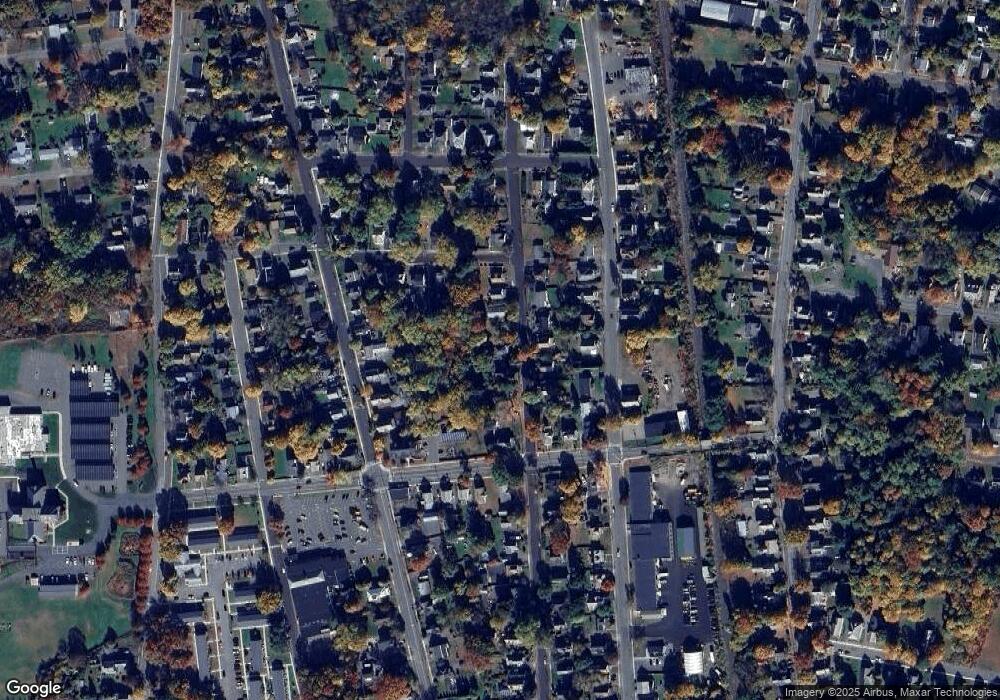
72 Beech St Greenfield, MA 01301
Estimated Value: $277,000 - $309,000
3
Beds
1
Bath
1,664
Sq Ft
$176/Sq Ft
Est. Value
About This Home
This home is located at 72 Beech St, Greenfield, MA 01301 and is currently estimated at $292,165, approximately $175 per square foot. 72 Beech St is a home located in Franklin County with nearby schools including Cornerstone Christian School and Holy Trinity School.
Ownership History
Date
Name
Owned For
Owner Type
Purchase Details
Closed on
Aug 19, 2013
Sold by
Friedner Sharon Y and Marston Rachel C
Bought by
Friedner Sharon Y
Current Estimated Value
Home Financials for this Owner
Home Financials are based on the most recent Mortgage that was taken out on this home.
Original Mortgage
$135,000
Outstanding Balance
$89,296
Interest Rate
4.31%
Mortgage Type
New Conventional
Estimated Equity
$202,870
Purchase Details
Closed on
Dec 14, 2006
Sold by
Bittle Carl W and Bittle Colleen A
Bought by
Marston Rachel C and Friedner Sharon Y
Purchase Details
Closed on
Aug 23, 1996
Sold by
Pepyne Heidi E and Pepyne Byron D
Bought by
Bittle Carl W and Bittle Colleen A
Purchase Details
Closed on
Dec 29, 1989
Sold by
Rodovich Robert F
Bought by
Pepyne Byron D
Create a Home Valuation Report for This Property
The Home Valuation Report is an in-depth analysis detailing your home's value as well as a comparison with similar homes in the area
Home Values in the Area
Average Home Value in this Area
Purchase History
| Date | Buyer | Sale Price | Title Company |
|---|---|---|---|
| Friedner Sharon Y | -- | -- | |
| Friedner Sharon Y | -- | -- | |
| Marston Rachel C | $159,900 | -- | |
| Marston Rachel C | $159,900 | -- | |
| Bittle Carl W | $79,000 | -- | |
| Bittle Carl W | $79,000 | -- | |
| Pepyne Byron D | $85,000 | -- | |
| Pepyne Byron D | $85,000 | -- |
Source: Public Records
Mortgage History
| Date | Status | Borrower | Loan Amount |
|---|---|---|---|
| Open | Pepyne Byron D | $135,000 | |
| Closed | Pepyne Byron D | $135,000 |
Source: Public Records
Tax History
| Year | Tax Paid | Tax Assessment Tax Assessment Total Assessment is a certain percentage of the fair market value that is determined by local assessors to be the total taxable value of land and additions on the property. | Land | Improvement |
|---|---|---|---|---|
| 2025 | $4,755 | $243,100 | $48,700 | $194,400 |
| 2024 | $4,243 | $208,100 | $44,500 | $163,600 |
| 2023 | $3,820 | $194,400 | $44,500 | $149,900 |
| 2022 | $3,710 | $166,200 | $42,300 | $123,900 |
| 2021 | $3,676 | $158,300 | $45,500 | $112,800 |
| 2020 | $3,339 | $145,600 | $41,300 | $104,300 |
| 2019 | $3,139 | $140,400 | $36,000 | $104,400 |
| 2018 | $3,086 | $137,600 | $35,300 | $102,300 |
| 2017 | $2,990 | $137,600 | $35,300 | $102,300 |
| 2016 | $2,833 | $129,900 | $30,700 | $99,200 |
| 2015 | $2,933 | $130,300 | $31,100 | $99,200 |
| 2014 | $2,511 | $122,300 | $31,100 | $91,200 |
Source: Public Records
Map
Nearby Homes
Your Personal Tour Guide
Ask me questions while you tour the home.