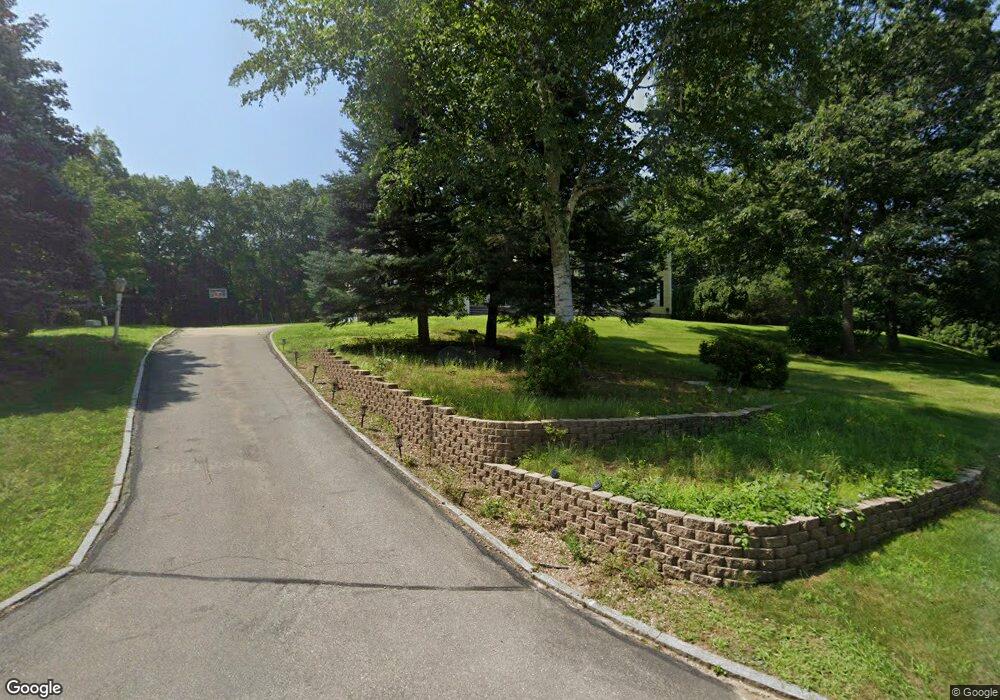
72 Blossom Rd Windham, NH 03087
Estimated Value: $1,447,699 - $1,773,000
5
Beds
4
Baths
4,600
Sq Ft
$349/Sq Ft
Est. Value
About This Home
This home is located at 72 Blossom Rd, Windham, NH 03087 and is currently estimated at $1,606,675, approximately $349 per square foot. 72 Blossom Rd is a home located in Rockingham County with nearby schools including Golden Brook Elementary School, Windham Middle School, and Windham High School.
Ownership History
Date
Name
Owned For
Owner Type
Purchase Details
Closed on
Apr 1, 2010
Sold by
Borase Virginia E
Bought by
Patel Hiral and Patel Hemant
Current Estimated Value
Home Financials for this Owner
Home Financials are based on the most recent Mortgage that was taken out on this home.
Original Mortgage
$523,000
Interest Rate
4.94%
Mortgage Type
Purchase Money Mortgage
Purchase Details
Closed on
Dec 5, 1996
Sold by
Reever Timothy and Reever Heidi
Bought by
Borase Vijay and Borase Virginia E
Create a Home Valuation Report for This Property
The Home Valuation Report is an in-depth analysis detailing your home's value as well as a comparison with similar homes in the area
Home Values in the Area
Average Home Value in this Area
Purchase History
| Date | Buyer | Sale Price | Title Company |
|---|---|---|---|
| Patel Hiral | $670,000 | -- | |
| Borase Vijay | $405,000 | -- |
Source: Public Records
Mortgage History
| Date | Status | Borrower | Loan Amount |
|---|---|---|---|
| Open | Borase Vijay | $488,000 | |
| Closed | Borase Vijay | $515,000 | |
| Closed | Borase Vijay | $523,000 | |
| Previous Owner | Borase Vijay | $50,000 |
Source: Public Records
Tax History Compared to Growth
Tax History
| Year | Tax Paid | Tax Assessment Tax Assessment Total Assessment is a certain percentage of the fair market value that is determined by local assessors to be the total taxable value of land and additions on the property. | Land | Improvement |
|---|---|---|---|---|
| 2024 | $18,522 | $818,100 | $228,200 | $589,900 |
| 2023 | $17,539 | $819,600 | $228,200 | $591,400 |
| 2022 | $16,195 | $819,600 | $228,200 | $591,400 |
| 2021 | $15,261 | $819,600 | $228,200 | $591,400 |
| 2020 | $15,526 | $811,600 | $228,200 | $583,400 |
| 2019 | $15,115 | $670,300 | $210,100 | $460,200 |
| 2018 | $15,611 | $670,300 | $210,100 | $460,200 |
| 2017 | $13,540 | $670,300 | $210,100 | $460,200 |
| 2016 | $14,626 | $670,300 | $210,100 | $460,200 |
| 2015 | $14,683 | $676,000 | $210,100 | $465,900 |
| 2014 | $14,618 | $609,100 | $230,000 | $379,100 |
| 2013 | $14,601 | $618,700 | $230,000 | $388,700 |
Source: Public Records
Map
Nearby Homes