Estimated Value: $625,000 - $734,000
5
Beds
2
Baths
2,657
Sq Ft
$252/Sq Ft
Est. Value
About This Home
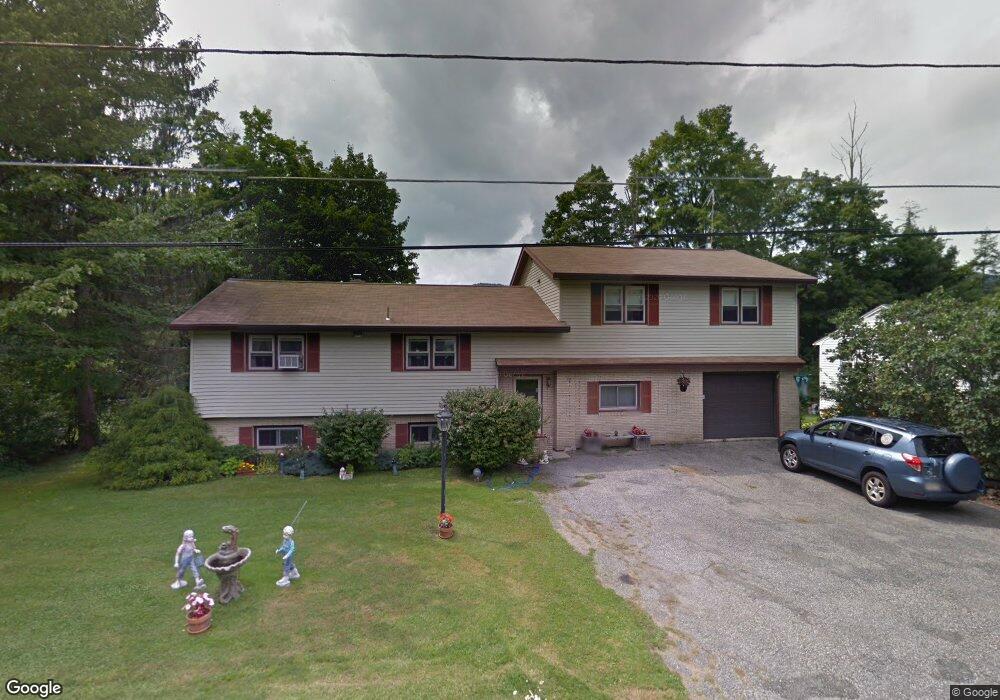
This home is located at 72 Brunell Ave, Lenox, MA 01240 and is currently estimated at $668,755, approximately $251 per square foot. 72 Brunell Ave is a home located in Berkshire County with nearby schools including Morris Elementary School, Lenox Memorial High School, and Berkshire Country Day School.
Ownership History
Date
Name
Owned For
Owner Type
Purchase Details
Closed on
Oct 31, 2023
Sold by
Corbett Edward L and Corbett Robert M
Bought by
Simonelli Scott and Simonelli Nicole
Current Estimated Value
Home Financials for this Owner
Home Financials are based on the most recent Mortgage that was taken out on this home.
Original Mortgage
$476,000
Outstanding Balance
$466,745
Interest Rate
7.18%
Mortgage Type
Purchase Money Mortgage
Estimated Equity
$202,010
Purchase Details
Closed on
Oct 16, 2013
Sold by
Corbett Edward L and Corbett Rachel C
Bought by
Corbett 3Rd Edward L and Corbett Robert M
Purchase Details
Closed on
May 15, 1964
Bought by
Corbett Edward L and Corbett Robert
Create a Home Valuation Report for This Property
The Home Valuation Report is an in-depth analysis detailing your home's value as well as a comparison with similar homes in the area
Home Values in the Area
Average Home Value in this Area
Purchase History
| Date | Buyer | Sale Price | Title Company |
|---|---|---|---|
| Simonelli Scott | $595,000 | None Available | |
| Simonelli Scott | $595,000 | None Available | |
| Corbett 3Rd Edward L | -- | -- | |
| Corbett 3Rd Edward L | -- | -- | |
| Corbett Edward L | -- | -- |
Source: Public Records
Mortgage History
| Date | Status | Borrower | Loan Amount |
|---|---|---|---|
| Open | Simonelli Scott | $476,000 | |
| Closed | Simonelli Scott | $476,000 | |
| Previous Owner | Corbett Edward L | $40,000 | |
| Previous Owner | Corbett Edward L | $20,000 |
Source: Public Records
Tax History Compared to Growth
Tax History
| Year | Tax Paid | Tax Assessment Tax Assessment Total Assessment is a certain percentage of the fair market value that is determined by local assessors to be the total taxable value of land and additions on the property. | Land | Improvement |
|---|---|---|---|---|
| 2025 | $4,053 | $447,900 | $147,900 | $300,000 |
| 2024 | $3,834 | $422,700 | $139,500 | $283,200 |
| 2023 | $3,667 | $400,300 | $127,500 | $272,800 |
| 2022 | $3,821 | $352,500 | $106,300 | $246,200 |
| 2021 | $3,819 | $327,800 | $97,500 | $230,300 |
| 2020 | $3,755 | $310,300 | $97,700 | $212,600 |
| 2019 | $3,635 | $304,200 | $97,700 | $206,500 |
| 2018 | $3,600 | $296,500 | $95,900 | $200,600 |
| 2017 | $3,575 | $292,800 | $94,000 | $198,800 |
| 2016 | $3,620 | $297,700 | $102,800 | $194,900 |
| 2015 | $3,579 | $290,300 | $102,800 | $187,500 |
Source: Public Records
Map
Nearby Homes
- 80 West St
- 59 Hawthorne St
- 19 Hawthorne St Unit Stables 1A
- 250 West St
- 2 Kemble St
- 7 Hubbard St
- 31 Saint Ann's Ave
- 15 Hubbard St
- 3 Morgan Manor Unit 3 - 8
- 9 Bolton Dr
- 319 Under Mountain Rd
- 13 Taconic Ave
- 137 Housatonic St
- 19 and 21 Wheatleigh Dr
- 9 Wheatleigh Dr
- 165 Kemble St Unit 5
- 165 Kemble St Unit 17
- 0 Main St
- 220 Kemble St
- 20 E Dugway Rd