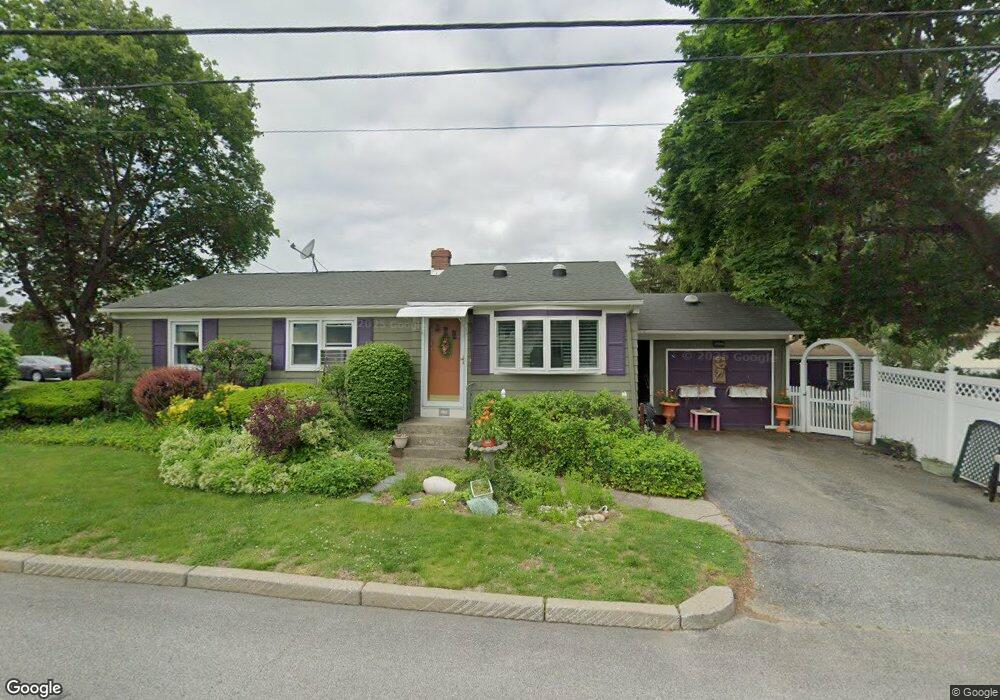
72 Cannon St Cranston, RI 02920
Thornton NeighborhoodEstimated Value: $408,857 - $498,000
About This Home
This home is located at 72 Cannon St, Cranston, RI 02920 and is currently estimated at $461,964, approximately $321 per square foot. 72 Cannon St is a home located in Providence County with nearby schools including Stone Hill School, Western Hills Middle School, and Cranston High School West.
Ownership History
We collect this data history from publicly available records. To have your information removed, we recommend requesting removal directly through your county’s website.
Purchase Details
Home Financials for this Owner
Home Financials are based on the most recent Mortgage that was taken out on this home.Home Values in the Area
Average Home Value in this Area
Purchase History
We collect this data history from publicly available records. To have your information removed, we recommend requesting removal directly through your county’s website.
| Date | Buyer | Sale Price | Title Company |
|---|---|---|---|
| $98,000 | -- |
Mortgage History
We collect this data history from publicly available records. To have your information removed, we recommend requesting removal directly through your county’s website.
| Date | Status | Borrower | Loan Amount |
|---|---|---|---|
| Open | $100,000 | ||
| Closed | $75,000 | ||
| Closed | $88,200 |
Tax History
We collect this data history from publicly available records. To have your information removed, we recommend requesting removal directly through your county’s website.
| Year | Tax Paid | Tax Assessment Tax Assessment Total Assessment is a certain percentage of the fair market value that is determined by local assessors to be the total taxable value of land and additions on the property. | Land | Improvement |
|---|---|---|---|---|
| 2025 | $4,462 | $321,500 | $107,900 | $213,600 |
| 2024 | $4,376 | $321,500 | $107,900 | $213,600 |
| 2023 | $4,281 | $226,500 | $71,000 | $155,500 |
| 2022 | $4,193 | $226,500 | $71,000 | $155,500 |
| 2021 | $4,077 | $226,500 | $71,000 | $155,500 |
| 2020 | $3,842 | $185,000 | $67,600 | $117,400 |
| 2019 | $3,842 | $185,000 | $67,600 | $117,400 |
| 2018 | $3,754 | $185,000 | $67,600 | $117,400 |
| 2017 | $3,815 | $166,300 | $60,900 | $105,400 |
| 2016 | $3,733 | $166,300 | $60,900 | $105,400 |
| 2015 | $3,733 | $166,300 | $60,900 | $105,400 |
| 2014 | $3,239 | $165,300 | $60,900 | $104,400 |
Map
- 60 Imperial Ave
- 27 Royal Ave
- 83 Valente Dr
- 200 Cannon St Unit 153
- 0 Macera Dr
- 150 Marlow St
- 18 Tacoma St
- 822 Atwood Ave
- 0 Clemence St
- 131 Woodland Ave
- 50 Clemence St Unit 50
- 31 Yeoman Ave
- 19 Curry Rd
- 1448 Plainfield Pike
- 0 Plainfield Pike Unit 1411477
- 1475 Plainfield Pike
- 16 Mill St
- 11 Bellevue Dr
- 0 Randall St
- 9 Custer Ave
Ask me questions while you tour the home.