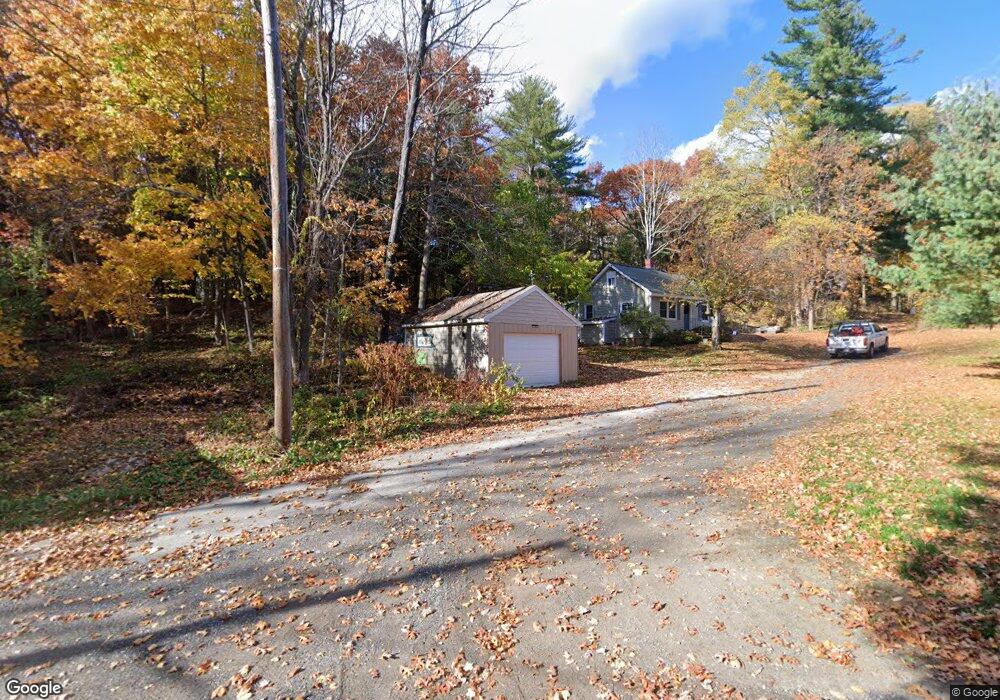
72 Cedar St Amesbury, MA 01913
Estimated Value: $366,000 - $534,000
2
Beds
1
Bath
678
Sq Ft
$672/Sq Ft
Est. Value
About This Home
This home is located at 72 Cedar St, Amesbury, MA 01913 and is currently estimated at $455,901, approximately $672 per square foot. 72 Cedar St is a home located in Essex County with nearby schools including Amesbury High School and Amesbury Seventh-Day Adventist School.
Ownership History
Date
Name
Owned For
Owner Type
Purchase Details
Closed on
Jun 1, 2000
Sold by
Woodward Dorothy E and Sayward Patricia A
Bought by
Nyman Seth and Nyman Sally C
Current Estimated Value
Home Financials for this Owner
Home Financials are based on the most recent Mortgage that was taken out on this home.
Original Mortgage
$76,000
Interest Rate
8.14%
Mortgage Type
Purchase Money Mortgage
Create a Home Valuation Report for This Property
The Home Valuation Report is an in-depth analysis detailing your home's value as well as a comparison with similar homes in the area
Home Values in the Area
Average Home Value in this Area
Purchase History
| Date | Buyer | Sale Price | Title Company |
|---|---|---|---|
| Nyman Seth | $95,000 | -- |
Source: Public Records
Mortgage History
| Date | Status | Borrower | Loan Amount |
|---|---|---|---|
| Open | Nyman Seth | $75,500 | |
| Closed | Nyman Seth | $76,000 |
Source: Public Records
Tax History Compared to Growth
Tax History
| Year | Tax Paid | Tax Assessment Tax Assessment Total Assessment is a certain percentage of the fair market value that is determined by local assessors to be the total taxable value of land and additions on the property. | Land | Improvement |
|---|---|---|---|---|
| 2025 | $7,720 | $504,600 | $309,500 | $195,100 |
| 2024 | $7,459 | $476,900 | $296,000 | $180,900 |
| 2023 | $7,409 | $453,400 | $282,000 | $171,400 |
| 2022 | $7,267 | $410,800 | $253,600 | $157,200 |
| 2021 | $6,721 | $368,300 | $214,800 | $153,500 |
| 2020 | $6,113 | $355,800 | $209,000 | $146,800 |
| 2019 | $5,834 | $317,600 | $209,000 | $108,600 |
| 2018 | $5,807 | $305,800 | $199,000 | $106,800 |
| 2017 | $5,817 | $291,600 | $199,000 | $92,600 |
| 2016 | $5,778 | $284,900 | $199,000 | $85,900 |
| 2015 | $5,575 | $271,400 | $199,000 | $72,400 |
| 2014 | $5,932 | $282,900 | $199,000 | $83,900 |
Source: Public Records
Map
Nearby Homes
- 105 Market St Unit B
- 103 Market St Unit A
- 103 Market St Unit B
- 7 Melrose St
- 101 Market St Unit B
- 101 Market St Unit A
- 25 Cedar St Unit 4
- 25 Cedar St Unit 7
- 57 Clinton St
- 97 Elm St
- 100 Congress St
- 5 Richs Ct Unit 3
- 3 Glenwood St
- 53 Market St
- 22 Huntington Ave
- 17 Linwood Place
- 1 Stacey Ln
- 3 Brown Ave Unit 75
- 1 Brown Ave Unit 3-78
- 1 Brown Ave Unit 3-80