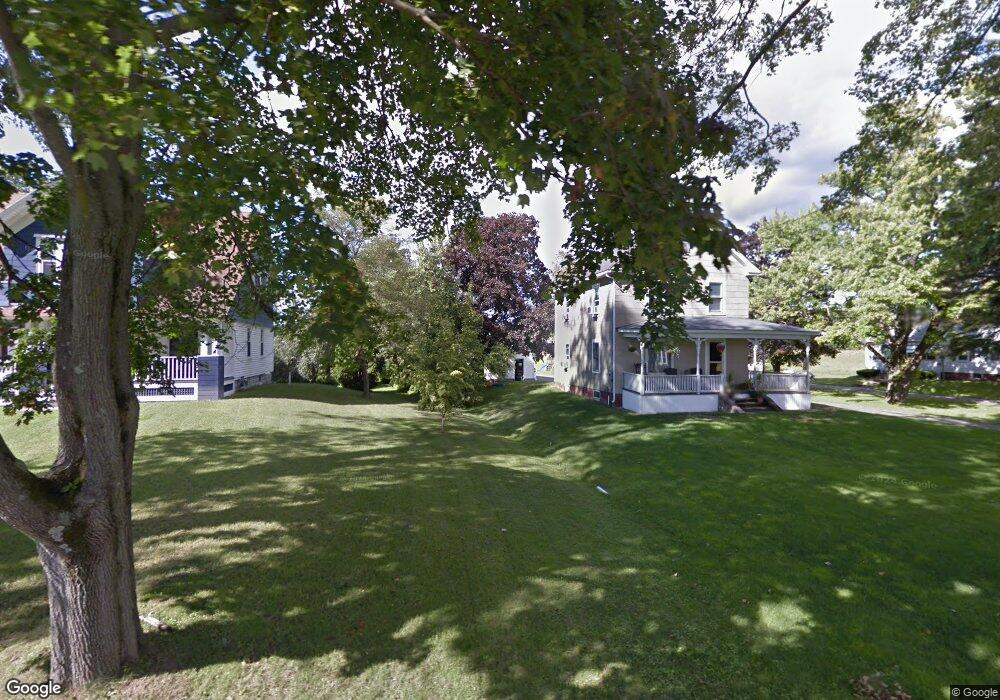
72 Chestnut St Hatfield, MA 01038
Estimated Value: $354,000 - $466,000
3
Beds
2
Baths
1,620
Sq Ft
$259/Sq Ft
Est. Value
About This Home
This home is located at 72 Chestnut St, Hatfield, MA 01038 and is currently estimated at $419,217, approximately $258 per square foot. 72 Chestnut St is a home located in Hampshire County with nearby schools including Hatfield Elementary School and Smith Academy.
Ownership History
Date
Name
Owned For
Owner Type
Purchase Details
Closed on
Apr 30, 2010
Sold by
Lapointe Nellie E
Bought by
Gingras Thomas N and Gingras Anita R
Current Estimated Value
Home Financials for this Owner
Home Financials are based on the most recent Mortgage that was taken out on this home.
Original Mortgage
$140,000
Outstanding Balance
$93,560
Interest Rate
4.99%
Mortgage Type
Purchase Money Mortgage
Estimated Equity
$325,657
Create a Home Valuation Report for This Property
The Home Valuation Report is an in-depth analysis detailing your home's value as well as a comparison with similar homes in the area
Home Values in the Area
Average Home Value in this Area
Purchase History
| Date | Buyer | Sale Price | Title Company |
|---|---|---|---|
| Gingras Thomas N | $175,000 | -- |
Source: Public Records
Mortgage History
| Date | Status | Borrower | Loan Amount |
|---|---|---|---|
| Open | Gingras Thomas N | $140,000 |
Source: Public Records
Tax History
| Year | Tax Paid | Tax Assessment Tax Assessment Total Assessment is a certain percentage of the fair market value that is determined by local assessors to be the total taxable value of land and additions on the property. | Land | Improvement |
|---|---|---|---|---|
| 2025 | $5,074 | $366,600 | $163,300 | $203,300 |
| 2024 | $4,820 | $314,800 | $142,600 | $172,200 |
| 2023 | $4,010 | $297,500 | $135,300 | $162,200 |
| 2022 | $3,814 | $279,000 | $128,600 | $150,400 |
| 2021 | $3,732 | $263,000 | $117,300 | $145,700 |
| 2020 | $3,558 | $263,000 | $117,300 | $145,700 |
| 2019 | $3,331 | $239,800 | $115,100 | $124,700 |
| 2018 | $3,251 | $239,400 | $115,100 | $124,300 |
| 2017 | $3,117 | $235,800 | $115,100 | $120,700 |
| 2016 | $3,092 | $234,600 | $115,100 | $119,500 |
| 2015 | $2,876 | $218,400 | $103,800 | $114,600 |
| 2014 | $2,473 | $195,200 | $103,800 | $91,400 |
Source: Public Records
Map
Nearby Homes
- 71 Chestnut St
- 149 Prospect St
- 18 Elm St
- 0 Straits Rd
- 58 Main St Unit 4
- 58 Main St Unit 3
- 59 N Hatfield Rd
- 43 Laurel Park Unit 43
- 151 Pantry Rd
- 32 Stonewall Dr
- 27 River Dr
- 11 West St
- 0 N Branch Rd
- 26 Russell St Unit A-B
- 80 Damon Rd Unit 8201
- 80 Damon Rd Unit 4302
- 88 Pines Edge Dr Unit 88
- 14 Hawley Rd
- 289 Hatfield St
- 128 West St
- 74 Chestnut St
- 70 Chestnut St
- 63 Chestnut St
- 78 Chestnut St
- 66 Chestnut St
- 69 Chestnut St
- 62 Chestnut St
- 6 Nolan Cir
- 82 Chestnut St
- 77 Chestnut St Unit 77D
- 77 Chestnut St Unit B
- 77 Chestnut St Unit A
- 77 Chestnut St
- 57 Chestnut St
- 64 Chestnut St
- 55 Chestnut St
- 3 Nolan Cir
- 7 Nolan Cir
- 5 Nolan Cir
- 56 Chestnut St
Your Personal Tour Guide
Ask me questions while you tour the home.