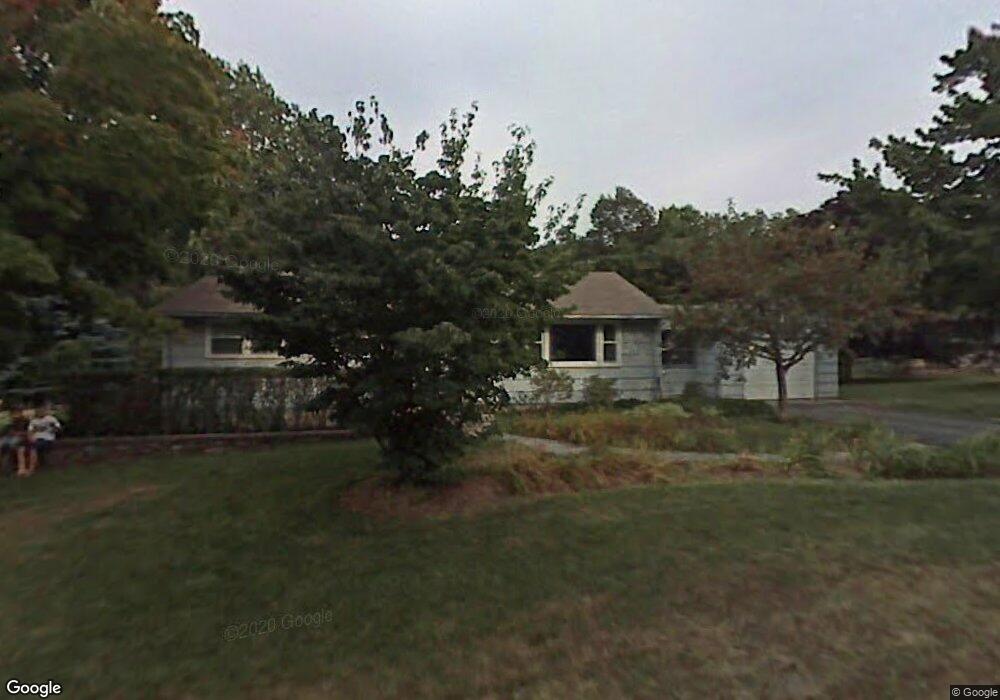
72 Cook St Holden, MA 01520
Estimated Value: $439,000 - $483,000
3
Beds
2
Baths
1,100
Sq Ft
$420/Sq Ft
Est. Value
About This Home
This home is located at 72 Cook St, Holden, MA 01520 and is currently estimated at $462,312, approximately $420 per square foot. 72 Cook St is a home located in Worcester County with nearby schools including Wachusett Regional High School, Abby Kelley Foster Charter Public School, and Bancroft School.
Ownership History
Date
Name
Owned For
Owner Type
Purchase Details
Closed on
May 11, 2001
Sold by
Turner Laurence V
Bought by
Keller David R and Keller Kelly S
Current Estimated Value
Purchase Details
Closed on
Mar 27, 1996
Sold by
Rand James M and Rand Sarah
Bought by
Turner Laurence
Purchase Details
Closed on
Jul 30, 1987
Sold by
Wespi George E
Bought by
Rand J M
Create a Home Valuation Report for This Property
The Home Valuation Report is an in-depth analysis detailing your home's value as well as a comparison with similar homes in the area
Home Values in the Area
Average Home Value in this Area
Purchase History
| Date | Buyer | Sale Price | Title Company |
|---|---|---|---|
| Keller David R | $173,650 | -- | |
| Turner Laurence | $123,500 | -- | |
| Rand J M | $147,950 | -- |
Source: Public Records
Mortgage History
| Date | Status | Borrower | Loan Amount |
|---|---|---|---|
| Open | Rand J M | $153,000 | |
| Closed | Rand J M | $168,000 | |
| Closed | Rand J M | $151,200 |
Source: Public Records
Tax History
| Year | Tax Paid | Tax Assessment Tax Assessment Total Assessment is a certain percentage of the fair market value that is determined by local assessors to be the total taxable value of land and additions on the property. | Land | Improvement |
|---|---|---|---|---|
| 2025 | $5,532 | $399,100 | $155,300 | $243,800 |
| 2024 | $5,152 | $364,100 | $150,800 | $213,300 |
| 2023 | $4,968 | $331,400 | $131,100 | $200,300 |
| 2022 | $4,796 | $289,600 | $102,300 | $187,300 |
| 2021 | $4,152 | $266,500 | $97,500 | $169,000 |
| 2020 | $4,274 | $251,400 | $92,800 | $158,600 |
| 2019 | $3,524 | $241,000 | $92,800 | $148,200 |
| 2018 | $3,924 | $222,800 | $88,300 | $134,500 |
| 2017 | $3,828 | $217,600 | $88,300 | $129,300 |
| 2016 | $3,593 | $208,300 | $84,100 | $124,200 |
| 2015 | $3,588 | $198,000 | $84,100 | $113,900 |
| 2014 | $3,515 | $198,000 | $84,100 | $113,900 |
Source: Public Records
Map
Nearby Homes
- 12 Pinecroft Ave
- 38 Juniper Ln
- 30 Osgood Ave
- 39 Mountainshire Dr
- 22 Danielles Way
- 26 Danielles Way
- 31 Danielles Way
- 270 Brattle St
- 1110 W Boylston St Unit A
- 36 Sunrise Ave
- 6 Meadowbrook Dr
- 10 Beale St
- 12 Beale St
- 55 Apthorp St
- 53 Collins St
- 3 Torrey Ln
- 23 Gail Dr
- 48 Whispering Pine Cir Unit 48
- 1 Highland Ave
- 42 N Worcester Ave
Your Personal Tour Guide
Ask me questions while you tour the home.