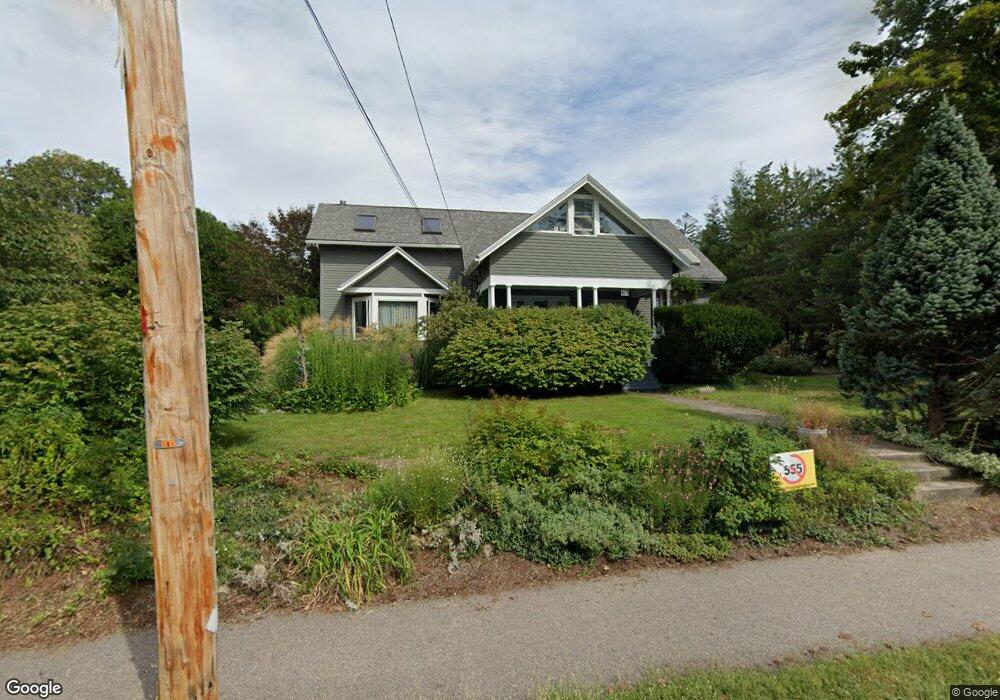
72 Elm St Holliston, MA 01746
Estimated Value: $683,340 - $827,000
3
Beds
2
Baths
2,459
Sq Ft
$317/Sq Ft
Est. Value
About This Home
This home is located at 72 Elm St, Holliston, MA 01746 and is currently estimated at $778,585, approximately $316 per square foot. 72 Elm St is a home located in Middlesex County with nearby schools including Placentino Elementary School, Miller Elementary School, and Robert H. Adams Middle School.
Ownership History
Date
Name
Owned For
Owner Type
Purchase Details
Closed on
Dec 30, 2020
Sold by
Chapin John A and Leavey Susan D
Bought by
John A Chapin T
Current Estimated Value
Purchase Details
Closed on
May 4, 2010
Sold by
Chapin John A and Leavey Susan D
Bought by
Chapin John A and Leavey Susan D
Purchase Details
Closed on
Aug 24, 1979
Bought by
Chapin John A and Leavey Susan D
Create a Home Valuation Report for This Property
The Home Valuation Report is an in-depth analysis detailing your home's value as well as a comparison with similar homes in the area
Home Values in the Area
Average Home Value in this Area
Purchase History
| Date | Buyer | Sale Price | Title Company |
|---|---|---|---|
| John A Chapin T | -- | None Available | |
| Chapin John A | -- | -- | |
| Chapin John A | $53,000 | -- |
Source: Public Records
Mortgage History
| Date | Status | Borrower | Loan Amount |
|---|---|---|---|
| Previous Owner | Chapin John A | $30,000 | |
| Previous Owner | Chapin John A | $160,000 | |
| Previous Owner | Chapin John A | $139,000 |
Source: Public Records
Tax History
| Year | Tax Paid | Tax Assessment Tax Assessment Total Assessment is a certain percentage of the fair market value that is determined by local assessors to be the total taxable value of land and additions on the property. | Land | Improvement |
|---|---|---|---|---|
| 2025 | $8,014 | $547,000 | $247,200 | $299,800 |
| 2024 | $7,637 | $507,100 | $247,200 | $259,900 |
| 2023 | $7,212 | $468,300 | $247,200 | $221,100 |
| 2022 | $7,873 | $453,000 | $247,200 | $205,800 |
| 2021 | $6,953 | $389,500 | $183,700 | $205,800 |
| 2020 | $7,553 | $400,700 | $196,000 | $204,700 |
| 2019 | $6,779 | $360,000 | $186,600 | $173,400 |
| 2018 | $6,721 | $360,000 | $186,600 | $173,400 |
| 2017 | $6,858 | $370,300 | $192,300 | $178,000 |
| 2016 | $6,781 | $360,900 | $182,900 | $178,000 |
| 2015 | $6,407 | $330,600 | $158,100 | $172,500 |
Source: Public Records
Map
Nearby Homes
- 25 Irving Place
- 1366 Washington St
- 26 Mechanic St
- 154 Union St
- 6 Skyview Terrace
- 53 Regal St
- 22 Greenview Dr
- 18 Northway St
- 269 Concord St
- 66 Lakeshore Dr
- 615 Mayflower Landing
- 1 Danforth Dr
- 261 Rolling Meadow Dr
- 3 Danforth Dr
- 244 Rolling Meadow Dr
- 51 Burnap Rd Unit 3
- 67 Mohawk Path
- 59 Brooksmont Dr Unit 59
- 731 Norfolk St
- 0 Hill St
Your Personal Tour Guide
Ask me questions while you tour the home.