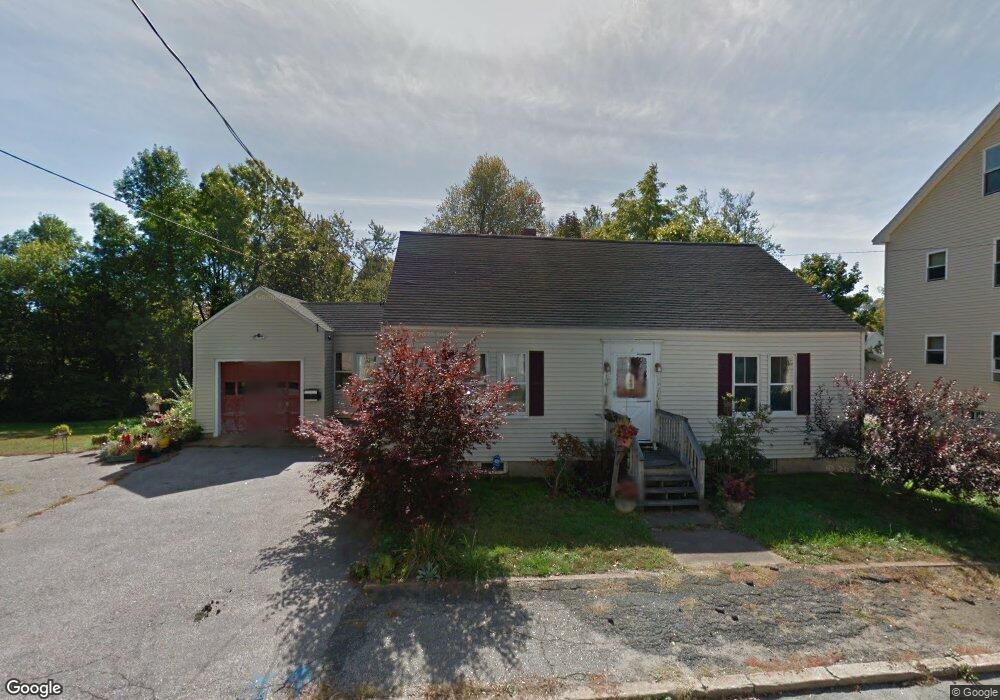
72 Franklin St Somersworth, NH 03878
Estimated Value: $345,000 - $403,257
3
Beds
2
Baths
1,650
Sq Ft
$225/Sq Ft
Est. Value
About This Home
This home is located at 72 Franklin St, Somersworth, NH 03878 and is currently estimated at $371,314, approximately $225 per square foot. 72 Franklin St is a home located in Strafford County with nearby schools including Maple Wood Elementary School, Somersworth High School, and Tri-City Christian Academy.
Ownership History
Date
Name
Owned For
Owner Type
Purchase Details
Closed on
Apr 13, 2015
Sold by
Crockett Sandra
Bought by
Johnson Melissa T and Johnson Richard L
Current Estimated Value
Home Financials for this Owner
Home Financials are based on the most recent Mortgage that was taken out on this home.
Original Mortgage
$125,408
Outstanding Balance
$96,647
Interest Rate
3.77%
Mortgage Type
New Conventional
Estimated Equity
$274,667
Purchase Details
Closed on
Jul 29, 2003
Sold by
Current Ethan P
Bought by
Crockett Sandra
Home Financials for this Owner
Home Financials are based on the most recent Mortgage that was taken out on this home.
Original Mortgage
$100,000
Interest Rate
5.27%
Purchase Details
Closed on
May 21, 1998
Sold by
Usa Va
Bought by
Current Mary J
Purchase Details
Closed on
Jun 10, 1997
Sold by
Barss Kevin R
Bought by
Secy Of Vetrns Affairs
Create a Home Valuation Report for This Property
The Home Valuation Report is an in-depth analysis detailing your home's value as well as a comparison with similar homes in the area
Home Values in the Area
Average Home Value in this Area
Purchase History
| Date | Buyer | Sale Price | Title Company |
|---|---|---|---|
| Johnson Melissa T | $122,933 | -- | |
| Johnson Melissa T | $122,933 | -- | |
| Crockett Sandra | $125,000 | -- | |
| Crockett Sandra | $125,000 | -- | |
| Current Mary J | $90,000 | -- | |
| Current Mary J | $90,000 | -- | |
| Secy Of Vetrns Affairs | $73,500 | -- | |
| Secy Of Vetrns Affairs | $73,500 | -- |
Source: Public Records
Mortgage History
| Date | Status | Borrower | Loan Amount |
|---|---|---|---|
| Open | Secy Of Vetrns Affairs | $125,408 | |
| Closed | Secy Of Vetrns Affairs | $125,408 | |
| Previous Owner | Secy Of Vetrns Affairs | $100,000 |
Source: Public Records
Tax History Compared to Growth
Tax History
| Year | Tax Paid | Tax Assessment Tax Assessment Total Assessment is a certain percentage of the fair market value that is determined by local assessors to be the total taxable value of land and additions on the property. | Land | Improvement |
|---|---|---|---|---|
| 2024 | $6,306 | $337,200 | $71,400 | $265,800 |
| 2023 | $5,675 | $193,700 | $32,100 | $161,600 |
| 2022 | $5,441 | $193,700 | $32,100 | $161,600 |
| 2021 | $5,261 | $191,100 | $32,100 | $159,000 |
| 2020 | $5,311 | $190,700 | $32,100 | $158,600 |
| 2019 | $5,202 | $190,700 | $32,100 | $158,600 |
| 2018 | $5,650 | $169,100 | $53,600 | $115,500 |
| 2017 | $3,260 | $169,000 | $53,600 | $115,400 |
| 2016 | $28 | $169,000 | $53,600 | $115,400 |
| 2015 | $5,450 | $169,000 | $53,600 | $115,400 |
| 2014 | $5,263 | $169,000 | $53,600 | $115,400 |
Source: Public Records
Map
Nearby Homes
- 8 Myrtle St
- 37 Franklin St
- 178 High St
- 208 Main St
- 14 Central St
- 105-107 Main St
- 23 Mount Vernon St
- 22A Birch Hill Ln Unit 22A
- 18 Grand St
- 24-26 Highland St
- 22B Birch Hill Ln Unit 22B
- 19B Birch Hill Ln Unit 19B
- 19A Birch Hill Ln Unit 19A
- 27B Birch Hill Ln Unit 27B
- 23B Birch Hill Ln Unit 23B
- 23A Birch Hill Ln Unit 23A
- 10 Turgeon's Ln
- 17 2nd St
- 25 High St
- 3 Bennett St
- 98 Franklin St Unit 98
- 96 Franklin St Unit 1
- 100 Franklin St Unit C
- 98 Franklin St Unit C
- 34 Franklin St Unit A
- 96 Franklin St
- 96 Franklin St Unit 96
- 100 Franklin St Unit 100
- 58 Franklin St
- 69 Franklin St
- 63 Franklin St
- 54-56 Franklin St
- 67 Franklin St
- 54 Franklin St Unit 54
- 54 Franklin St Unit A
- 54 Franklin St
- 71 Franklin St
- 61 Franklin St
- 56 Franklin St
- 56 Franklin St Unit 56 Franklin Street