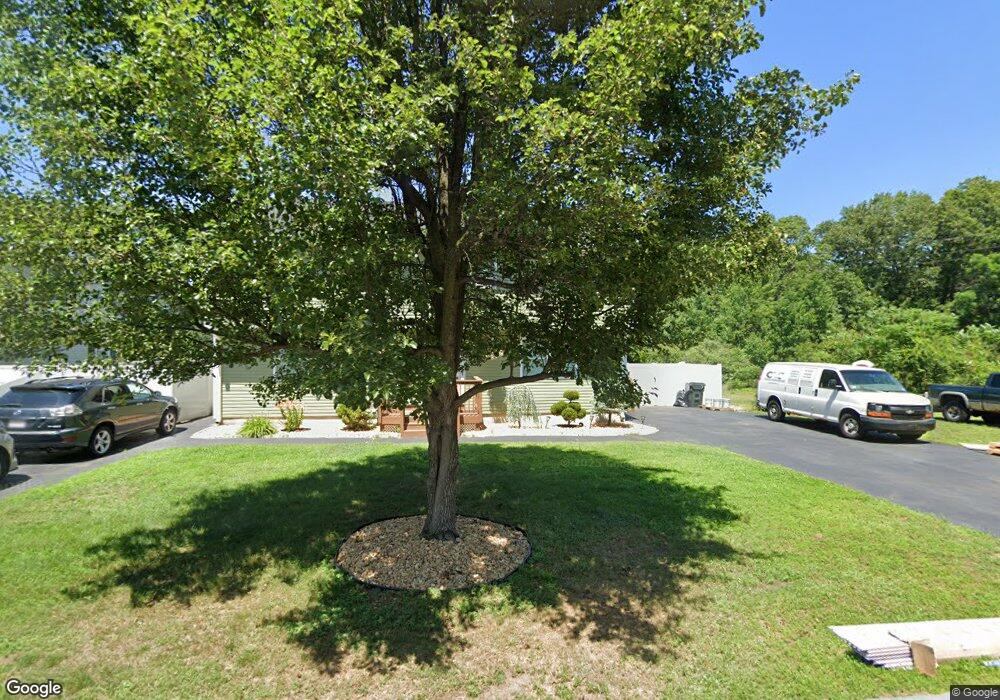
72 Glenmore St Springfield, MA 01129
Boston Road NeighborhoodEstimated Value: $284,599 - $406,000
3
Beds
2
Baths
1,320
Sq Ft
$247/Sq Ft
Est. Value
About This Home
This home is located at 72 Glenmore St, Springfield, MA 01129 and is currently estimated at $325,900, approximately $246 per square foot. 72 Glenmore St is a home located in Hampden County with nearby schools including Warner, John F. Kennedy Academy, and Roger L. Putnam Vocational Technical Academy.
Ownership History
Date
Name
Owned For
Owner Type
Purchase Details
Closed on
Jul 20, 2018
Sold by
Santiago Maria I
Bought by
Santiago Greysha M
Current Estimated Value
Home Financials for this Owner
Home Financials are based on the most recent Mortgage that was taken out on this home.
Original Mortgage
$240,562
Outstanding Balance
$210,209
Interest Rate
5.25%
Mortgage Type
FHA
Estimated Equity
$115,691
Purchase Details
Closed on
Mar 30, 2004
Sold by
Varga Maria I
Bought by
Santiago Harold A and Santiago Maria I
Create a Home Valuation Report for This Property
The Home Valuation Report is an in-depth analysis detailing your home's value as well as a comparison with similar homes in the area
Home Values in the Area
Average Home Value in this Area
Purchase History
| Date | Buyer | Sale Price | Title Company |
|---|---|---|---|
| Santiago Greysha M | $245,000 | -- | |
| Santiago Harold A | -- | -- |
Source: Public Records
Mortgage History
| Date | Status | Borrower | Loan Amount |
|---|---|---|---|
| Open | Santiago Greysha M | $240,562 |
Source: Public Records
Tax History
| Year | Tax Paid | Tax Assessment Tax Assessment Total Assessment is a certain percentage of the fair market value that is determined by local assessors to be the total taxable value of land and additions on the property. | Land | Improvement |
|---|---|---|---|---|
| 2025 | $3,429 | $218,700 | $44,600 | $174,100 |
| 2024 | $3,379 | $210,400 | $41,700 | $168,700 |
| 2023 | $3,209 | $188,200 | $34,200 | $154,000 |
| 2022 | $3,216 | $170,900 | $32,000 | $138,900 |
| 2021 | $2,850 | $150,800 | $29,100 | $121,700 |
| 2020 | $2,828 | $144,800 | $36,100 | $108,700 |
| 2019 | $2,848 | $144,700 | $36,100 | $108,600 |
| 2018 | $3,702 | $123,300 | $36,100 | $87,200 |
| 2017 | $3,702 | $188,300 | $36,100 | $152,200 |
| 2016 | $3,368 | $171,300 | $36,100 | $135,200 |
| 2015 | $3,214 | $163,400 | $36,100 | $127,300 |
Source: Public Records
Map
Nearby Homes
- 74 Glenmore St
- 80 Glenmore St
- 82 Glenmore St
- 88 Glenmore St
- 90 Glenmore St
- 71 Glenmore St
- 75 Glenmore St
- 79 Glenmore St
- 94 Glenmore St
- 63 Glenmore St
- 81 Glenmore St
- 91 Glenmore St
- 91 Glenmore St Unit NO
- 98 Glenmore St
- 53 Glenmore St
- 93 Glenmore St
- 47 Glenmore St
- 104 Glenmore St
- 41 Glenmore St
- 101 Glenmore St
Your Personal Tour Guide
Ask me questions while you tour the home.