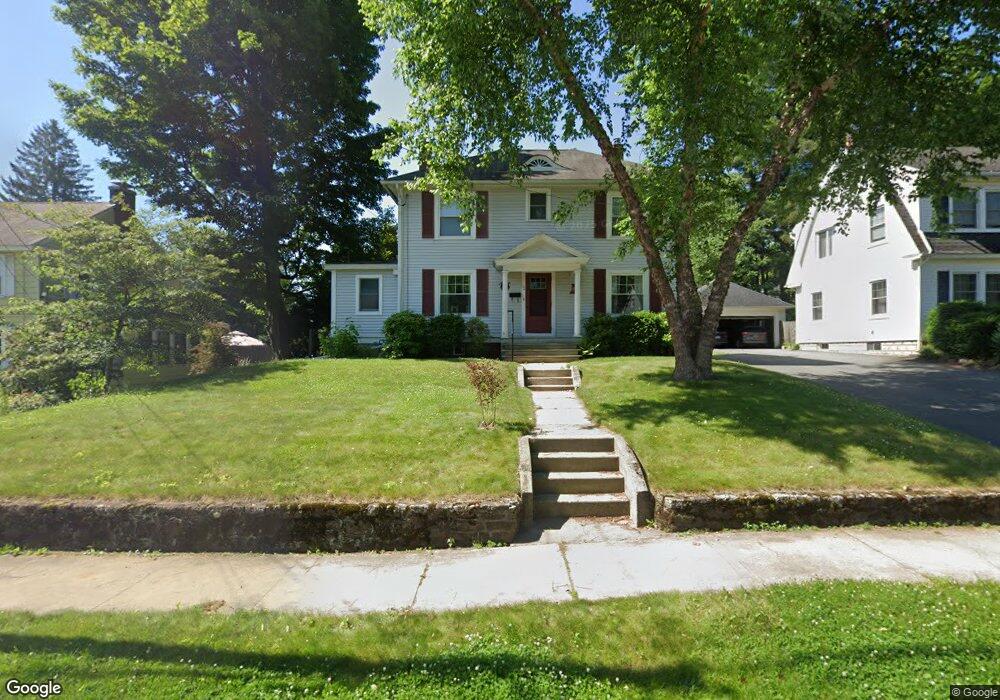
72 Hastings St Greenfield, MA 01301
Estimated Value: $339,000 - $391,000
3
Beds
2
Baths
1,568
Sq Ft
$230/Sq Ft
Est. Value
About This Home
This home is located at 72 Hastings St, Greenfield, MA 01301 and is currently estimated at $360,579, approximately $229 per square foot. 72 Hastings St is a home located in Franklin County with nearby schools including Holy Trinity School and Cornerstone Christian School.
Ownership History
Date
Name
Owned For
Owner Type
Purchase Details
Closed on
Oct 17, 2017
Sold by
Haro Alexander J and Serrentino Patricia
Bought by
In Patricia Serrentino
Current Estimated Value
Purchase Details
Closed on
Apr 22, 1992
Sold by
Blanchard Terrence A and Blanchard Kathleen
Bought by
Serrentino Patricia and Haro Alexander J
Create a Home Valuation Report for This Property
The Home Valuation Report is an in-depth analysis detailing your home's value as well as a comparison with similar homes in the area
Home Values in the Area
Average Home Value in this Area
Purchase History
| Date | Buyer | Sale Price | Title Company |
|---|---|---|---|
| In Patricia Serrentino | -- | -- | |
| Patricia Serrentino In | -- | -- | |
| Serrentino Patricia | $101,000 | -- | |
| Serrentino Patricia | $101,000 | -- |
Source: Public Records
Mortgage History
| Date | Status | Borrower | Loan Amount |
|---|---|---|---|
| Previous Owner | Serrentino Patricia | $50,000 | |
| Previous Owner | Serrentino Patricia | $30,000 | |
| Previous Owner | Serrentino Patricia | $13,300 | |
| Previous Owner | Serrentino Patricia | $79,000 |
Source: Public Records
Tax History Compared to Growth
Tax History
| Year | Tax Paid | Tax Assessment Tax Assessment Total Assessment is a certain percentage of the fair market value that is determined by local assessors to be the total taxable value of land and additions on the property. | Land | Improvement |
|---|---|---|---|---|
| 2025 | $5,389 | $275,500 | $72,600 | $202,900 |
| 2024 | $5,330 | $261,400 | $59,800 | $201,600 |
| 2023 | $4,835 | $244,600 | $59,800 | $184,800 |
| 2022 | $4,681 | $209,700 | $56,900 | $152,800 |
| 2021 | $4,386 | $188,900 | $56,900 | $132,000 |
| 2020 | $4,219 | $184,000 | $56,900 | $127,100 |
| 2019 | $3,947 | $176,500 | $49,400 | $127,100 |
| 2018 | $3,880 | $173,000 | $48,400 | $124,600 |
| 2017 | $3,735 | $171,900 | $48,400 | $123,500 |
| 2016 | $3,847 | $176,400 | $51,200 | $125,200 |
| 2015 | $3,809 | $169,200 | $51,200 | $118,000 |
| 2014 | $3,474 | $169,200 | $51,200 | $118,000 |
Source: Public Records
Map
Nearby Homes