72 Highland View Dr Sutton, MA 01590
Estimated Value: $614,000 - $752,000
3
Beds
3
Baths
1,648
Sq Ft
$411/Sq Ft
Est. Value
About This Home
This home is located at 72 Highland View Dr, Sutton, MA 01590 and is currently estimated at $677,852, approximately $411 per square foot. 72 Highland View Dr is a home located in Worcester County with nearby schools including Sutton Elementary School, Sutton Middle School, and Sutton High School.
Ownership History
Date
Name
Owned For
Owner Type
Purchase Details
Closed on
Nov 5, 2024
Sold by
Alderman Ft and Desrosiers
Bought by
Alderman Kara M and Desrosiers Elizabeth K
Current Estimated Value
Purchase Details
Closed on
Nov 4, 2024
Sold by
Alderman Clarke J Est and Desrosiers
Bought by
Alderman Ft and Desrosiers
Purchase Details
Closed on
Oct 10, 2014
Sold by
Alderman Cheryl F
Bought by
Alderman Clarke J
Create a Home Valuation Report for This Property
The Home Valuation Report is an in-depth analysis detailing your home's value as well as a comparison with similar homes in the area
Home Values in the Area
Average Home Value in this Area
Purchase History
| Date | Buyer | Sale Price | Title Company |
|---|---|---|---|
| Alderman Kara M | -- | None Available | |
| Alderman Kara M | -- | None Available | |
| Alderman Ft | -- | None Available | |
| Alderman Ft | -- | None Available | |
| Alderman Clarke J | -- | -- | |
| Alderman Clarke J | -- | -- |
Source: Public Records
Mortgage History
| Date | Status | Borrower | Loan Amount |
|---|---|---|---|
| Previous Owner | Alderman Clarke J | $134,000 | |
| Previous Owner | Alderman Clarke J | $156,500 |
Source: Public Records
Tax History Compared to Growth
Tax History
| Year | Tax Paid | Tax Assessment Tax Assessment Total Assessment is a certain percentage of the fair market value that is determined by local assessors to be the total taxable value of land and additions on the property. | Land | Improvement |
|---|---|---|---|---|
| 2025 | $7,349 | $589,800 | $207,700 | $382,100 |
| 2024 | $7,039 | $546,100 | $181,500 | $364,600 |
| 2023 | $6,537 | $464,300 | $164,000 | $300,300 |
| 2022 | $6,273 | $404,200 | $131,300 | $272,900 |
| 2021 | $6,161 | $377,300 | $131,300 | $246,000 |
| 2020 | $6,169 | $377,300 | $131,300 | $246,000 |
| 2019 | $5,880 | $346,700 | $126,500 | $220,200 |
| 2018 | $5,671 | $333,400 | $126,500 | $206,900 |
| 2017 | $5,473 | $322,700 | $110,500 | $212,200 |
| 2016 | $5,397 | $314,700 | $110,500 | $204,200 |
| 2015 | $5,198 | $304,000 | $110,500 | $193,500 |
| 2014 | $5,188 | $297,500 | $114,000 | $183,500 |
Source: Public Records
Map
Nearby Homes
- 50 Highland View Dr
- 29 Highland View Dr
- 19 Wildflower Dr
- 5 Wildflower Dr
- 90 Leland Hill Rd
- 185 Main St
- 7 B Herbert Dr Unit 14
- 20 Millers Way Unit C
- 7 Pine Hill Rd
- 11 Coldspring Dr Unit B
- 191 Hartness Rd
- 24 Coldspring Dr Unit B
- 82 Central Turnpike
- 175 Armsby Rd
- 55 Fisherville Terrace
- 51 Fisherville Terrace
- 58 Fisherville Terrace
- 44 Fisherville Terrace
- 109 Main St
- 166 Armsby Rd
- 74 Highland View Dr
- 68 Highland View Dr
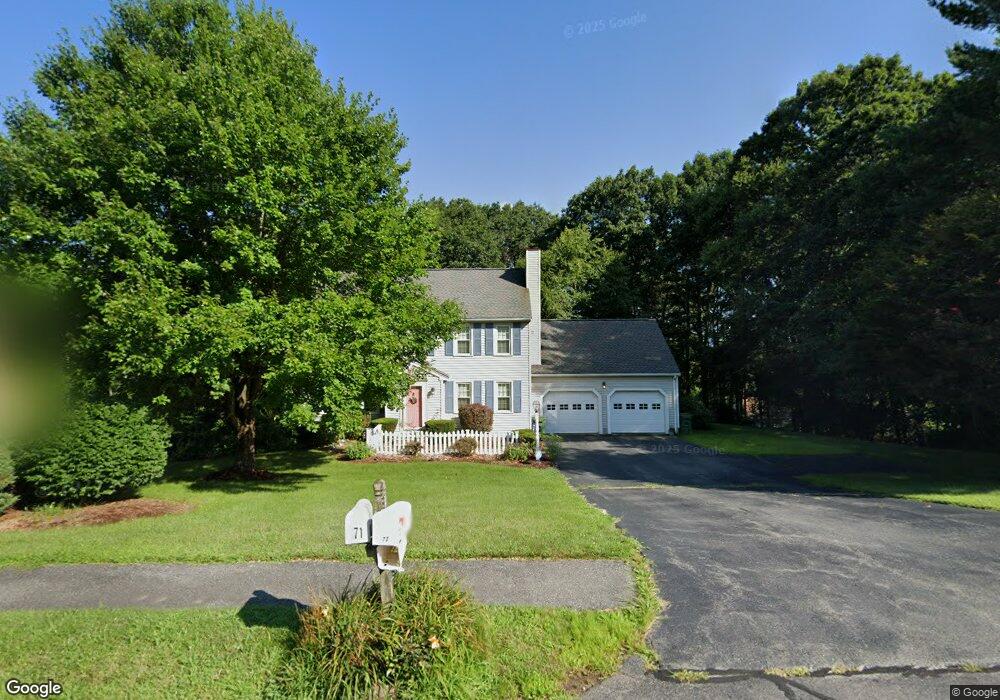
- 71 Highland View Dr
- 48 Dodge Rd
- 69 Highland View Dr
- 52 Dodge Rd
- 73 Highland View Dr
- 78 Highland View Dr
- 66 Highland View Dr
- 65 Highland View Dr
- 44 Dodge Rd
- 45 Highland View Dr
- 77 Highland View Dr
- 49 Highland View Dr
- 56 Dodge Rd
- 43 Highland View Dr
- 61 Highland View Dr
- 80 Highland View Dr
- 49 Dodge Rd
- 41 Highland View Dr