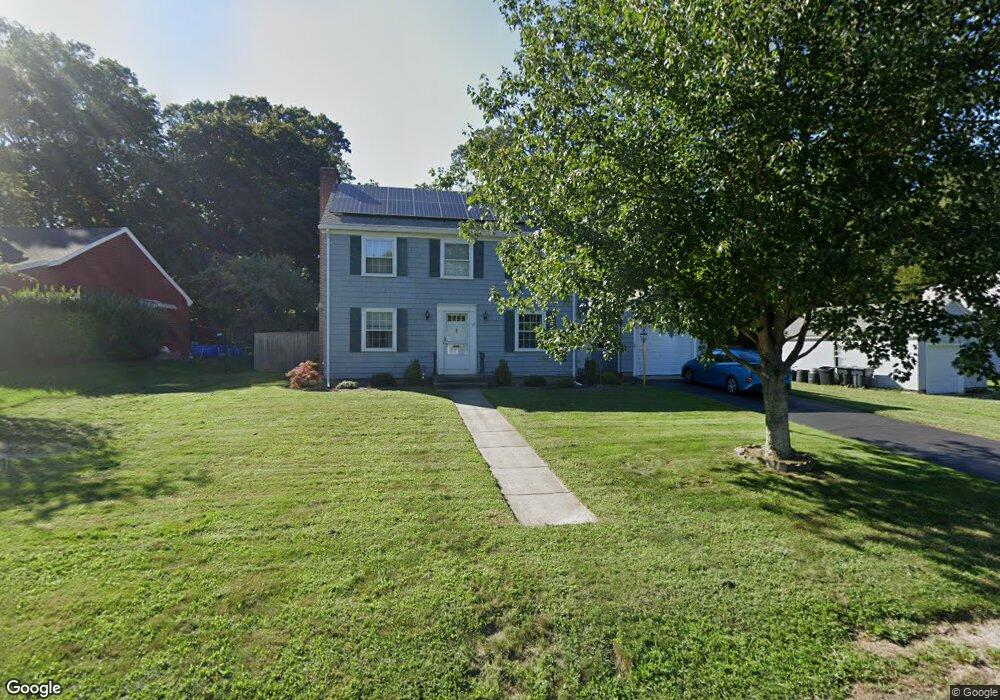
72 Indian Rd Riverside, RI 02915
Riverside NeighborhoodEstimated Value: $450,000 - $613,000
3
Beds
2
Baths
1,800
Sq Ft
$290/Sq Ft
Est. Value
About This Home
This home is located at 72 Indian Rd, Riverside, RI 02915 and is currently estimated at $522,293, approximately $290 per square foot. 72 Indian Rd is a home located in Providence County with nearby schools including East Providence High School, St Mary Academy-Bay View, and The Gordon School.
Ownership History
Date
Name
Owned For
Owner Type
Purchase Details
Closed on
Nov 13, 2018
Sold by
Supinski Alice B and Supinski David J
Bought by
Supinski Ft and Supinski
Current Estimated Value
Purchase Details
Closed on
Jun 18, 2014
Sold by
Gregory Alice B
Bought by
Gregory Alice B and Supinski David J
Purchase Details
Closed on
Dec 19, 2006
Sold by
Gallahger Patrick G
Bought by
Gregory Alice B
Home Financials for this Owner
Home Financials are based on the most recent Mortgage that was taken out on this home.
Original Mortgage
$100,000
Interest Rate
6.31%
Mortgage Type
Purchase Money Mortgage
Purchase Details
Closed on
Sep 28, 1999
Sold by
Schmidtt Dorothy
Bought by
Gallagher Patrick G
Create a Home Valuation Report for This Property
The Home Valuation Report is an in-depth analysis detailing your home's value as well as a comparison with similar homes in the area
Home Values in the Area
Average Home Value in this Area
Purchase History
| Date | Buyer | Sale Price | Title Company |
|---|---|---|---|
| Supinski Ft | -- | -- | |
| Gregory Alice B | -- | -- | |
| Gregory Alice B | -- | -- | |
| Gregory Alice B | $340,000 | -- | |
| Gallagher Patrick G | $153,000 | -- | |
| Supinski Ft | -- | -- | |
| Gregory Alice B | -- | -- | |
| Gregory Alice B | $340,000 | -- | |
| Gallagher Patrick G | $153,000 | -- |
Source: Public Records
Mortgage History
| Date | Status | Borrower | Loan Amount |
|---|---|---|---|
| Previous Owner | Gallagher Patrick G | $96,000 | |
| Previous Owner | Gallagher Patrick G | $100,000 |
Source: Public Records
Tax History
| Year | Tax Paid | Tax Assessment Tax Assessment Total Assessment is a certain percentage of the fair market value that is determined by local assessors to be the total taxable value of land and additions on the property. | Land | Improvement |
|---|---|---|---|---|
| 2025 | $5,683 | $434,800 | $139,900 | $294,900 |
| 2024 | $5,710 | $372,500 | $116,600 | $255,900 |
| 2023 | $5,498 | $372,500 | $116,600 | $255,900 |
| 2022 | $5,450 | $249,300 | $60,900 | $188,400 |
| 2021 | $5,360 | $249,300 | $60,900 | $188,400 |
| 2020 | $5,133 | $249,300 | $60,900 | $188,400 |
| 2019 | $4,991 | $249,300 | $60,900 | $188,400 |
| 2018 | $4,500 | $196,700 | $59,400 | $137,300 |
| 2017 | $4,400 | $196,700 | $59,400 | $137,300 |
| 2016 | $4,379 | $196,700 | $59,400 | $137,300 |
| 2015 | $4,432 | $193,100 | $55,100 | $138,000 |
| 2014 | $4,432 | $193,100 | $55,100 | $138,000 |
Source: Public Records
Map
Nearby Homes
- 151 Willett Ave Unit 2
- 25 Arnold St
- 6 Fuller Ave
- 43 Bullocks Point Ave Unit 4A
- 25 Bullocks Point Ave Unit 5C
- 33 Bullocks Point Ave Unit 5C
- 103 Burnside Ave
- 28 Jefferson Ave
- 33 Pine St Unit 35
- 25 Winslow St
- 14 Benedict St
- 14 Winthrop St
- 72 Stowe Ave
- 129 Shore Rd
- 2941 Pawtucket Ave
- 42 Mountain Ave
- 41 White Ave
- 53 Wampanoag Trail
- 15 Claire St
- 10 Booth Ave
Your Personal Tour Guide
Ask me questions while you tour the home.