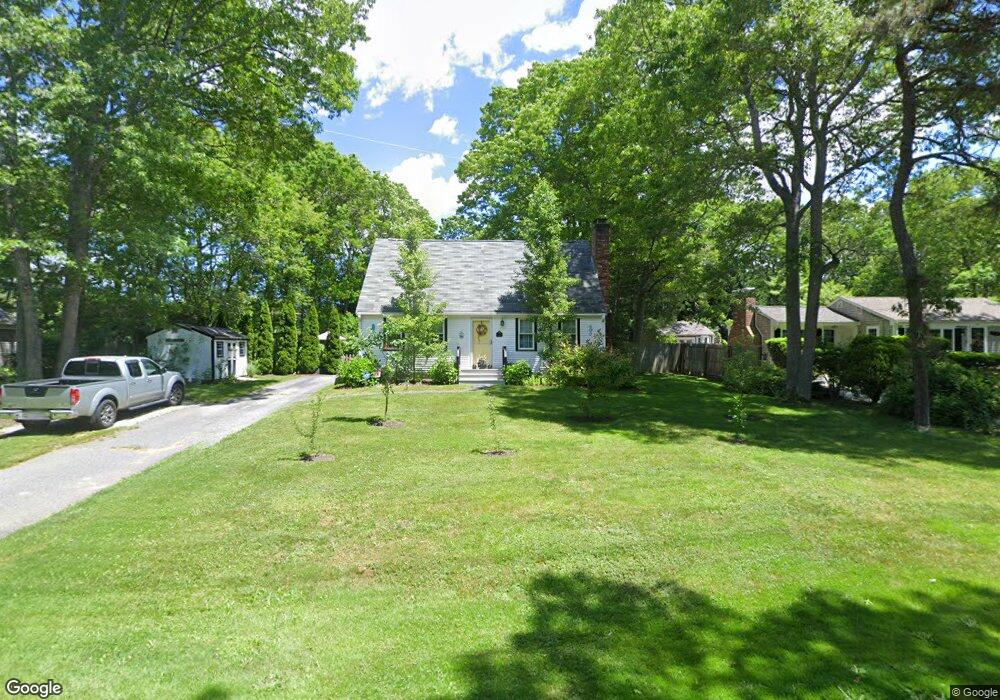
72 Kiahs Way East Sandwich, MA 02537
Estimated Value: $580,337 - $648,000
3
Beds
3
Baths
1,428
Sq Ft
$432/Sq Ft
Est. Value
About This Home
This home is located at 72 Kiahs Way, East Sandwich, MA 02537 and is currently estimated at $617,084, approximately $432 per square foot. 72 Kiahs Way is a home located in Barnstable County with nearby schools including Sandwich Middle High School, Montessori School of Sandwich, and Riverview School.
Ownership History
Date
Name
Owned For
Owner Type
Purchase Details
Closed on
Aug 24, 2017
Sold by
Burke Jaime A
Bought by
Crossman Keith M and Crossman Patricia J
Current Estimated Value
Home Financials for this Owner
Home Financials are based on the most recent Mortgage that was taken out on this home.
Original Mortgage
$170,000
Outstanding Balance
$142,119
Interest Rate
4.03%
Mortgage Type
New Conventional
Estimated Equity
$474,965
Purchase Details
Closed on
May 5, 2016
Sold by
Burke John J and Burke Jaime A
Bought by
Burke Jaime A
Purchase Details
Closed on
Aug 27, 2004
Sold by
Leary Dorothy A and Pallai Jean T
Bought by
Burke Jaime A and Burke John J
Home Financials for this Owner
Home Financials are based on the most recent Mortgage that was taken out on this home.
Original Mortgage
$305,000
Interest Rate
6.02%
Mortgage Type
Purchase Money Mortgage
Purchase Details
Closed on
May 5, 2000
Sold by
Obrien Dolores
Bought by
Leary Dorothy A
Create a Home Valuation Report for This Property
The Home Valuation Report is an in-depth analysis detailing your home's value as well as a comparison with similar homes in the area
Home Values in the Area
Average Home Value in this Area
Purchase History
| Date | Buyer | Sale Price | Title Company |
|---|---|---|---|
| Crossman Keith M | $315,000 | -- | |
| Burke Jaime A | -- | -- | |
| Burke Jaime A | $305,000 | -- | |
| Leary Dorothy A | $174,900 | -- |
Source: Public Records
Mortgage History
| Date | Status | Borrower | Loan Amount |
|---|---|---|---|
| Open | Crossman Keith M | $170,000 | |
| Previous Owner | Burke Jaime A | $305,000 |
Source: Public Records
Tax History Compared to Growth
Tax History
| Year | Tax Paid | Tax Assessment Tax Assessment Total Assessment is a certain percentage of the fair market value that is determined by local assessors to be the total taxable value of land and additions on the property. | Land | Improvement |
|---|---|---|---|---|
| 2025 | $4,799 | $454,000 | $156,000 | $298,000 |
| 2024 | $4,542 | $420,600 | $139,300 | $281,300 |
| 2023 | $4,438 | $385,900 | $126,700 | $259,200 |
| 2022 | $4,244 | $322,500 | $113,100 | $209,400 |
| 2021 | $4,062 | $295,000 | $108,700 | $186,300 |
| 2020 | $4,050 | $283,000 | $106,200 | $176,800 |
| 2019 | $3,865 | $269,900 | $104,300 | $165,600 |
| 2018 | $3,491 | $244,300 | $100,700 | $143,600 |
| 2017 | $4,323 | $231,500 | $97,400 | $134,100 |
| 2016 | $3,288 | $227,200 | $96,500 | $130,700 |
| 2015 | $3,188 | $215,100 | $86,900 | $128,200 |
Source: Public Records
Map
Nearby Homes
- 25 Deerwood Dr
- 186 Quaker Meeting House Rd
- 15 Lakewood Dr
- 52 Windsor Rd
- 296 Cotuit Rd
- 9 Crestview Drive Extension
- 2 Marie Ln
- 193 Farmersville Rd
- 363 Service Rd
- 21 Manor Dr
- 5 Whiffletree Cir
- 1 Peggys Ln
- 20 Crestview Dr
- 394 Quaker Meetinghouse Rd
- 394 Quaker Meeting House Rd
- 15 Surrey Ln
- 7 Horseshoe Cir
- 4 Royal Cir
- 49 Atkins Rd