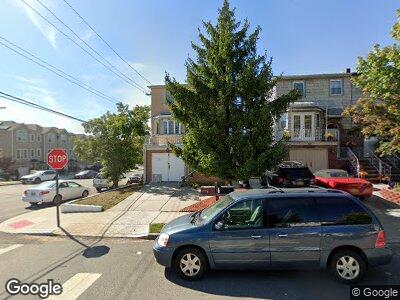
72 Kingsbridge Ave Staten Island, NY 10314
Bulls Head NeighborhoodEstimated Value: $738,446 - $823,000
--
Bed
--
Bath
1,470
Sq Ft
$534/Sq Ft
Est. Value
About This Home
This home is located at 72 Kingsbridge Ave, Staten Island, NY 10314 and is currently estimated at $784,862, approximately $533 per square foot. 72 Kingsbridge Ave is a home located in Richmond County with nearby schools including P.S. 060 Alice Austen School, Is 72 Rocco Laurie, and Port Richmond High School.
Ownership History
Date
Name
Owned For
Owner Type
Purchase Details
Closed on
Feb 26, 2018
Sold by
Zylo Qemal and Zylo Keze
Bought by
Watkins Valbona Zylo and Halsted Klodiana Zylo
Current Estimated Value
Purchase Details
Closed on
Sep 20, 2005
Sold by
Zylo Qemal
Bought by
Zylo Qemal and Zylo Keze
Purchase Details
Closed on
Oct 22, 2003
Sold by
Terrano Anthony and Pellegrino Joan A
Bought by
Zylo Qemal
Home Financials for this Owner
Home Financials are based on the most recent Mortgage that was taken out on this home.
Original Mortgage
$281,000
Interest Rate
5.82%
Mortgage Type
Purchase Money Mortgage
Purchase Details
Closed on
Mar 3, 1997
Sold by
Terrano Anthony and Terrano Helen
Bought by
Terrano Anthony and Pelligrino Joan A
Home Financials for this Owner
Home Financials are based on the most recent Mortgage that was taken out on this home.
Original Mortgage
$49,049
Interest Rate
7.79%
Create a Home Valuation Report for This Property
The Home Valuation Report is an in-depth analysis detailing your home's value as well as a comparison with similar homes in the area
Home Values in the Area
Average Home Value in this Area
Purchase History
| Date | Buyer | Sale Price | Title Company |
|---|---|---|---|
| Watkins Valbona Zylo | -- | Judicial Title | |
| Zylo Qemal | -- | -- | |
| Zylo Qemal | $381,000 | Commonwealth Land Title Insu | |
| Terrano Anthony | $125,000 | Commonwealth Land Title Ins |
Source: Public Records
Mortgage History
| Date | Status | Borrower | Loan Amount |
|---|---|---|---|
| Open | Zylo Qemal | $13,022 | |
| Previous Owner | Zylo Qemal | $281,000 | |
| Previous Owner | Terrano Anthony | $49,049 |
Source: Public Records
Tax History Compared to Growth
Tax History
| Year | Tax Paid | Tax Assessment Tax Assessment Total Assessment is a certain percentage of the fair market value that is determined by local assessors to be the total taxable value of land and additions on the property. | Land | Improvement |
|---|---|---|---|---|
| 2024 | $7,019 | $44,820 | $9,764 | $35,056 |
| 2023 | $7,085 | $36,288 | $9,712 | $26,576 |
| 2022 | $6,902 | $41,160 | $12,060 | $29,100 |
| 2021 | $6,847 | $38,340 | $12,060 | $26,280 |
| 2020 | $6,489 | $38,820 | $12,060 | $26,760 |
| 2019 | $6,033 | $42,120 | $12,060 | $30,060 |
| 2018 | $5,867 | $30,240 | $10,758 | $19,482 |
| 2017 | $5,818 | $30,012 | $11,382 | $18,630 |
| 2016 | $5,350 | $28,314 | $10,637 | $17,677 |
| 2015 | $4,531 | $26,712 | $8,957 | $17,755 |
| 2014 | $4,531 | $25,200 | $10,140 | $15,060 |
Source: Public Records
Map
Nearby Homes
- 143 Roman Ave
- 140 Roman Ave
- 109 Roman Ave
- 185 Lamberts Ln
- 39 Longdale St
- 66 Hirsch Ln
- 147 Kirshon Ave
- 276 Lander Ave
- 8 Nadal Place
- 11 Nadal Place
- 24 Nadal Place
- 341 Hillman Ave
- 44 Oliver Place
- 76 Graham Ave
- 85 Regal Walk Unit 100
- 963 Goethals Rd N Unit 137
- 268 Ada Dr
- 47 Regal Walk Unit 141
- 273 Arlene St
- 68 Regal Walk Unit 48
- 72 Kingsbridge Ave
- 68 Kingsbridge Ave
- 64 Kingsbridge Ave Unit 66
- 64-66 Kingsbridge Ave
- 62 Kingsbridge Ave
- 89 Elson St
- 87 Elson St
- 60 Kingsbridge Ave
- 83 Elson St
- 238 Lamberts Ln
- 244 Lamberts Ln
- 246 Lamberts Ln
- 81 Elson St
- 236 Lamberts Ln
- 248 Lamberts Ln
- 234 Lamberts Ln
- 58 Kingsbridge Ave
- 250 Lamberts Ln
- 232 Lamberts Ln
- 77 Elson St