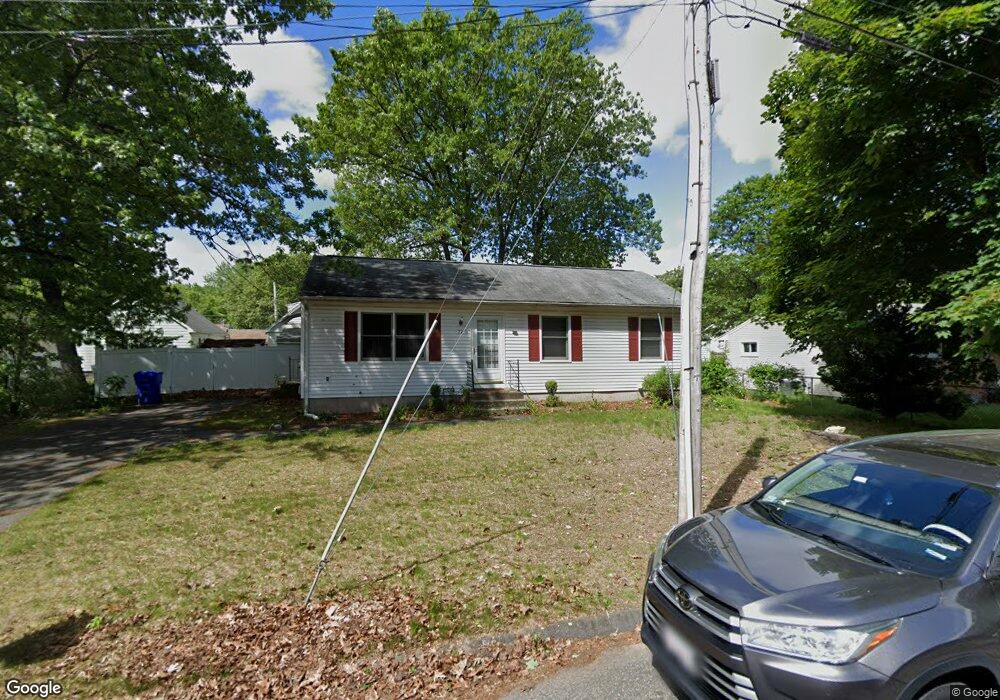
72 Lois St Springfield, MA 01109
Pine Point NeighborhoodEstimated Value: $241,000 - $281,331
3
Beds
2
Baths
1,092
Sq Ft
$244/Sq Ft
Est. Value
About This Home
This home is located at 72 Lois St, Springfield, MA 01109 and is currently estimated at $266,333, approximately $243 per square foot. 72 Lois St is a home located in Hampden County with nearby schools including Homer Street Elementary School, John F. Kennedy Academy, and Roger L. Putnam Vocational Technical Academy.
Ownership History
Date
Name
Owned For
Owner Type
Purchase Details
Closed on
May 30, 2007
Sold by
Smtih Mark H
Bought by
Brown Kimberly
Current Estimated Value
Home Financials for this Owner
Home Financials are based on the most recent Mortgage that was taken out on this home.
Original Mortgage
$165,000
Outstanding Balance
$101,236
Interest Rate
6.24%
Mortgage Type
Purchase Money Mortgage
Estimated Equity
$165,097
Purchase Details
Closed on
Apr 10, 1998
Sold by
William J Harper Inc
Bought by
Smith Mark and Smith Sherry
Home Financials for this Owner
Home Financials are based on the most recent Mortgage that was taken out on this home.
Original Mortgage
$75,900
Interest Rate
6.98%
Mortgage Type
Purchase Money Mortgage
Create a Home Valuation Report for This Property
The Home Valuation Report is an in-depth analysis detailing your home's value as well as a comparison with similar homes in the area
Home Values in the Area
Average Home Value in this Area
Purchase History
| Date | Buyer | Sale Price | Title Company |
|---|---|---|---|
| Brown Kimberly | $165,000 | -- | |
| Smith Mark | $79,900 | -- |
Source: Public Records
Mortgage History
| Date | Status | Borrower | Loan Amount |
|---|---|---|---|
| Open | Brown Kimberly | $165,000 | |
| Previous Owner | Smith Mark | $75,900 |
Source: Public Records
Tax History
| Year | Tax Paid | Tax Assessment Tax Assessment Total Assessment is a certain percentage of the fair market value that is determined by local assessors to be the total taxable value of land and additions on the property. | Land | Improvement |
|---|---|---|---|---|
| 2025 | $3,677 | $234,500 | $40,500 | $194,000 |
| 2024 | $3,663 | $228,100 | $33,700 | $194,400 |
| 2023 | $3,761 | $220,600 | $30,600 | $190,000 |
| 2022 | $2,983 | $158,500 | $28,700 | $129,800 |
| 2021 | $2,873 | $152,000 | $26,100 | $125,900 |
| 2020 | $2,836 | $145,200 | $26,100 | $119,100 |
| 2019 | $2,576 | $130,900 | $26,100 | $104,800 |
| 2018 | $2,614 | $132,800 | $26,100 | $106,700 |
| 2017 | $2,689 | $136,800 | $24,100 | $112,700 |
| 2016 | $2,399 | $122,000 | $24,100 | $97,900 |
| 2015 | $2,319 | $117,900 | $24,100 | $93,800 |
Source: Public Records
Map
Nearby Homes