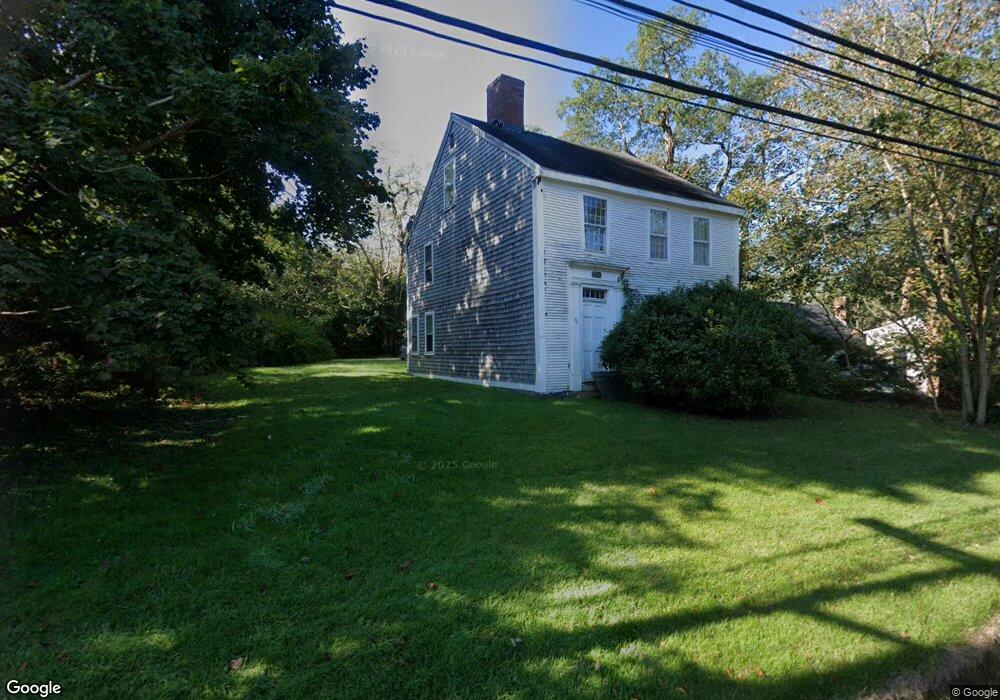
72 Main St Sandwich, MA 02563
Estimated Value: $588,000 - $727,000
2
Beds
2
Baths
1,744
Sq Ft
$384/Sq Ft
Est. Value
About This Home
This home is located at 72 Main St, Sandwich, MA 02563 and is currently estimated at $669,018, approximately $383 per square foot. 72 Main St is a home located in Barnstable County with nearby schools including Sandwich Middle High School, Waldorf School of Cape Cod, and Bridgeview Montessori School.
Ownership History
Date
Name
Owned For
Owner Type
Purchase Details
Closed on
May 21, 2025
Sold by
72 Main Llc
Bought by
Buffum Cyrus and Bates Brittany
Current Estimated Value
Home Financials for this Owner
Home Financials are based on the most recent Mortgage that was taken out on this home.
Original Mortgage
$335,000
Outstanding Balance
$332,587
Interest Rate
6.62%
Mortgage Type
New Conventional
Estimated Equity
$336,431
Purchase Details
Closed on
Jun 3, 2024
Sold by
Peterson Anne M Est and Monahan
Bought by
72 Main Llc
Purchase Details
Closed on
Jan 30, 1978
Bought by
Wallace Anne M
Create a Home Valuation Report for This Property
The Home Valuation Report is an in-depth analysis detailing your home's value as well as a comparison with similar homes in the area
Purchase History
| Date | Buyer | Sale Price | Title Company |
|---|---|---|---|
| Buffum Cyrus | -- | None Available | |
| Buffum Cyrus | -- | None Available | |
| 72 Main Llc | $350,000 | None Available | |
| 72 Main Llc | $350,000 | None Available | |
| 72 Main Llc | $350,000 | None Available | |
| Wallace Anne M | -- | -- |
Source: Public Records
Mortgage History
| Date | Status | Borrower | Loan Amount |
|---|---|---|---|
| Open | Buffum Cyrus | $335,000 | |
| Closed | Buffum Cyrus | $335,000 | |
| Previous Owner | Wallace Anne M | $40,000 | |
| Previous Owner | Wallace Anne M | $55,000 | |
| Previous Owner | Wallace Anne M | $55,000 |
Source: Public Records
Tax History
| Year | Tax Paid | Tax Assessment Tax Assessment Total Assessment is a certain percentage of the fair market value that is determined by local assessors to be the total taxable value of land and additions on the property. | Land | Improvement |
|---|---|---|---|---|
| 2025 | $5,964 | $564,200 | $261,600 | $302,600 |
| 2024 | $5,882 | $544,600 | $233,600 | $311,000 |
| 2023 | $5,345 | $464,800 | $182,000 | $282,800 |
| 2022 | $5,509 | $418,600 | $162,500 | $256,100 |
| 2021 | $5,296 | $384,600 | $156,200 | $228,400 |
| 2020 | $5,375 | $375,600 | $159,000 | $216,600 |
| 2019 | $5,059 | $353,300 | $149,800 | $203,500 |
| 2018 | $0 | $334,500 | $144,700 | $189,800 |
| 2017 | $4,548 | $304,600 | $140,000 | $164,600 |
| 2016 | $4,244 | $293,300 | $132,900 | $160,400 |
| 2015 | $4,077 | $275,100 | $119,700 | $155,400 |
Source: Public Records
Map
Nearby Homes
- 7 Bourne Ave
- 5 Candlewood Dr
- 5 Pine St
- 15 Route 6a
- 71 Tupper Rd
- 132 Main St
- 16 Town Neck Rd
- 6 Burg Ave
- 3 Boardwalk Rd
- 7 Sunrise Ln
- 78 Highview Dr
- 33 Highview Dr Unit 33
- 2 Freeman Ave
- 4 Freeman Ave
- 9 Coach Ln
- 12 Freeman Ave
- 14 Freeman Ave
- 8 Dewey Ave
- 1-3 White Cap Path Unit 1&3
- 5 White Cap Path Unit 5
Your Personal Tour Guide
Ask me questions while you tour the home.