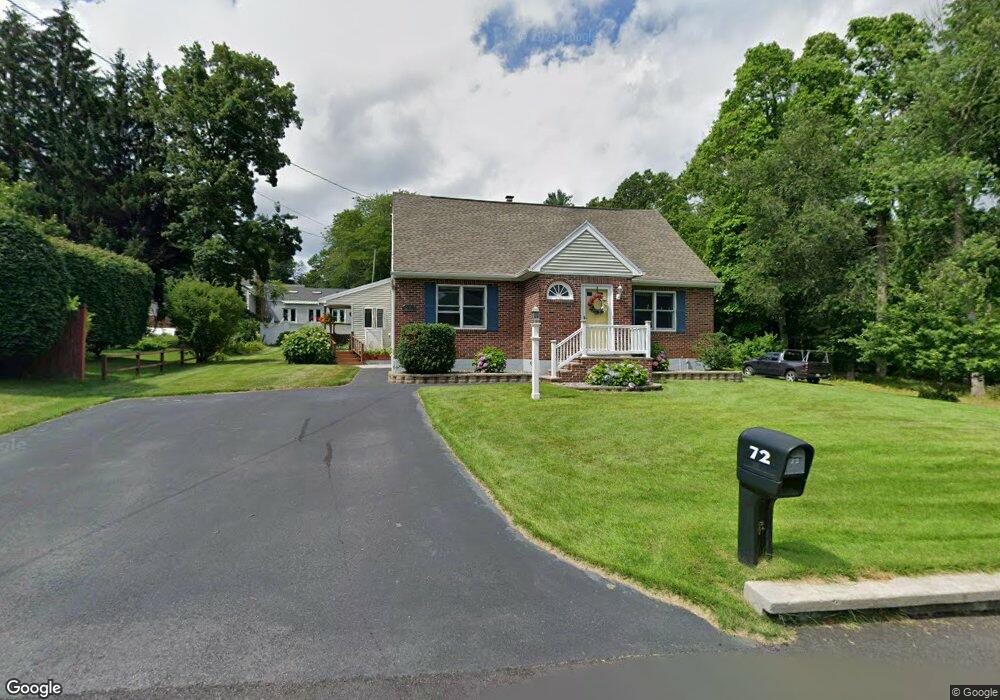
72 Morris St Dracut, MA 01826
Estimated Value: $561,000 - $700,000
4
Beds
5
Baths
2,218
Sq Ft
$287/Sq Ft
Est. Value
About This Home
This home is located at 72 Morris St, Dracut, MA 01826 and is currently estimated at $636,878, approximately $287 per square foot. 72 Morris St is a home located in Middlesex County with nearby schools including Joseph A. Campbell Elementary School, Richardson Middle School, and Dracut Senior High School.
Ownership History
Date
Name
Owned For
Owner Type
Purchase Details
Closed on
Oct 3, 2011
Sold by
Coolidge Marie A
Bought by
Coolidge Ft and Coolidge
Current Estimated Value
Purchase Details
Closed on
Mar 10, 2000
Sold by
Sweeney Ft and Sweeney
Bought by
Petroski Marie A
Home Financials for this Owner
Home Financials are based on the most recent Mortgage that was taken out on this home.
Original Mortgage
$95,000
Interest Rate
8.18%
Mortgage Type
Purchase Money Mortgage
Purchase Details
Closed on
Mar 5, 1998
Sold by
Krekorian Kimberly
Bought by
Blanton Edna M
Home Financials for this Owner
Home Financials are based on the most recent Mortgage that was taken out on this home.
Original Mortgage
$116,000
Interest Rate
6.93%
Mortgage Type
Purchase Money Mortgage
Create a Home Valuation Report for This Property
The Home Valuation Report is an in-depth analysis detailing your home's value as well as a comparison with similar homes in the area
Home Values in the Area
Average Home Value in this Area
Purchase History
| Date | Buyer | Sale Price | Title Company |
|---|---|---|---|
| Coolidge Ft | -- | -- | |
| Petroski Marie A | $167,000 | -- | |
| Blanton Edna M | $145,000 | -- |
Source: Public Records
Mortgage History
| Date | Status | Borrower | Loan Amount |
|---|---|---|---|
| Previous Owner | Blanton Edna M | $25,000 | |
| Previous Owner | Blanton Edna M | $95,000 | |
| Previous Owner | Blanton Edna M | $116,000 |
Source: Public Records
Tax History
| Year | Tax Paid | Tax Assessment Tax Assessment Total Assessment is a certain percentage of the fair market value that is determined by local assessors to be the total taxable value of land and additions on the property. | Land | Improvement |
|---|---|---|---|---|
| 2025 | $6,387 | $631,100 | $196,800 | $434,300 |
| 2024 | $6,121 | $585,700 | $187,400 | $398,300 |
| 2023 | $5,913 | $510,600 | $162,900 | $347,700 |
| 2022 | $6,005 | $488,600 | $148,000 | $340,600 |
| 2021 | $11,812 | $448,400 | $134,600 | $313,800 |
| 2020 | $380,400 | $421,500 | $130,700 | $290,800 |
| 2019 | $207,663 | $412,700 | $124,400 | $288,300 |
| 2018 | $8,367 | $359,200 | $124,400 | $234,800 |
| 2017 | $4,708 | $359,200 | $124,400 | $234,800 |
| 2016 | $4,548 | $306,500 | $119,600 | $186,900 |
| 2015 | $4,434 | $297,000 | $119,600 | $177,400 |
| 2014 | $4,192 | $289,300 | $119,600 | $169,700 |
Source: Public Records
Map
Nearby Homes
- 935 Methuen St Unit 13
- 84 Tellier Way
- 20 Mount Pleasant St
- 30 Parker Rd
- 31 Varnum Ave
- 821 Merrimack Ave
- 194 River Rd
- 11 Joseph Ave
- 206 Burnham Rd
- 89 Newbury St
- 2 Francis Dr Unit 405
- 4 Francis Dr Unit 312
- 4 Francis Dr Unit 207
- 2 Francis Dr Unit 301
- 100 Merrimack Ave Unit 9
- 144 Thissell Ave Unit 11
- 277 Loon Hill Rd
- 4 Hazelwood Ave Unit 12
- 45 Clark Rd
- 20 Mount Joy Dr
Your Personal Tour Guide
Ask me questions while you tour the home.