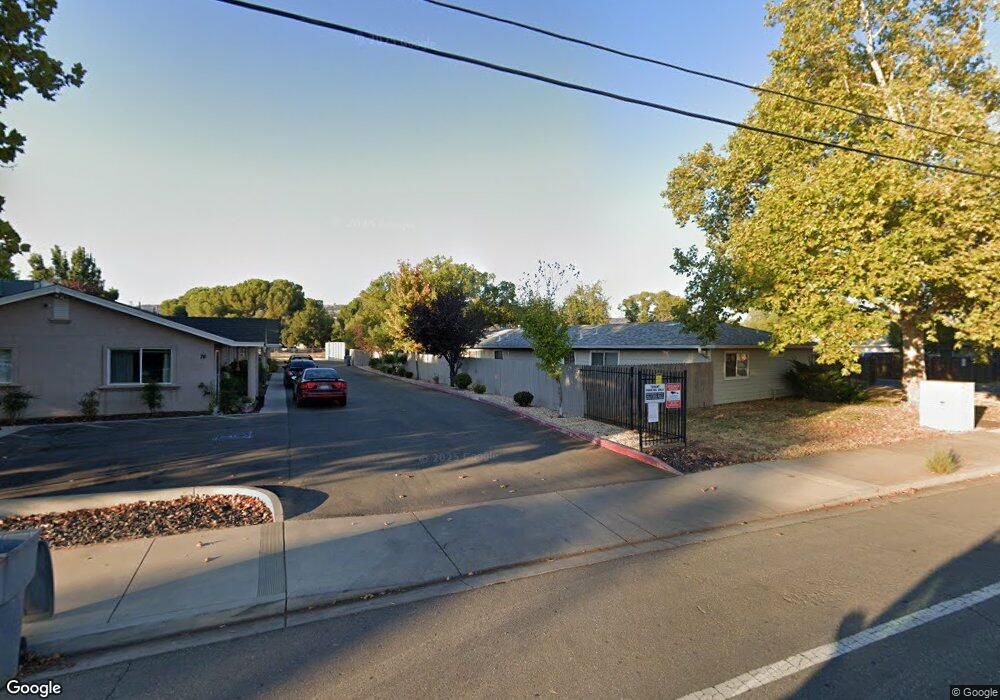
72 Nelson Ave Oroville, CA 95965
Estimated Value: $325,000 - $468,000
8
Beds
4
Baths
2,880
Sq Ft
$131/Sq Ft
Est. Value
About This Home
This home is located at 72 Nelson Ave, Oroville, CA 95965 and is currently estimated at $377,143, approximately $130 per square foot. 72 Nelson Ave is a home located in Butte County with nearby schools including Plumas Avenue Elementary School, Nelson Avenue Middle School, and Oroville High School.
Ownership History
Date
Name
Owned For
Owner Type
Purchase Details
Closed on
Dec 9, 2016
Sold by
Sweet Suzanne M
Bought by
Sweet Suzanne M and Kenneth R And Suzanne M Sweet Family Tru
Current Estimated Value
Purchase Details
Closed on
Apr 21, 2009
Sold by
Hayes Kevin L
Bought by
Sweet Kenneth R and Sweet Suzanne M
Purchase Details
Closed on
Apr 10, 2009
Sold by
Sawtelle Karen
Bought by
Hayes Kevin L
Purchase Details
Closed on
Sep 16, 2003
Sold by
Sawtelle Eric D
Bought by
Sawtelle Karen
Home Financials for this Owner
Home Financials are based on the most recent Mortgage that was taken out on this home.
Original Mortgage
$90,500
Interest Rate
6.5%
Mortgage Type
Purchase Money Mortgage
Create a Home Valuation Report for This Property
The Home Valuation Report is an in-depth analysis detailing your home's value as well as a comparison with similar homes in the area
Home Values in the Area
Average Home Value in this Area
Purchase History
| Date | Buyer | Sale Price | Title Company |
|---|---|---|---|
| Sweet Suzanne M | -- | None Available | |
| Sweet Suzanne M | -- | None Available | |
| Sweet Kenneth R | $175,000 | Mid Valley Title & Escrow Co | |
| Hayes Kevin L | -- | Mid Valley Title & Escrow Co | |
| Sawtelle Karen | -- | Mid Valley Title & Escrow Co | |
| Hayes Kevin L | -- | Mid Valley Title & Escrow Co | |
| Hayes Kevin L | $168,000 | Mid Valley Title & Escrow Co |
Source: Public Records
Mortgage History
| Date | Status | Borrower | Loan Amount |
|---|---|---|---|
| Previous Owner | Hayes Kevin L | $90,500 | |
| Closed | Hayes Kevin L | $71,000 |
Source: Public Records
Tax History
| Year | Tax Paid | Tax Assessment Tax Assessment Total Assessment is a certain percentage of the fair market value that is determined by local assessors to be the total taxable value of land and additions on the property. | Land | Improvement |
|---|---|---|---|---|
| 2025 | $4,653 | $224,767 | $51,502 | $173,265 |
| 2024 | $4,653 | $218,400 | $50,493 | $167,907 |
| 2023 | $4,759 | $216,118 | $49,503 | $166,615 |
| 2022 | $4,484 | $211,921 | $48,533 | $163,388 |
| 2021 | $4,373 | $207,806 | $47,582 | $160,224 |
| 2020 | $4,170 | $205,697 | $47,095 | $158,602 |
| 2019 | $4,139 | $201,704 | $46,172 | $155,532 |
| 2018 | $3,957 | $197,789 | $45,267 | $152,522 |
| 2017 | $3,878 | $193,951 | $44,380 | $149,571 |
| 2016 | $3,833 | $190,188 | $43,510 | $146,678 |
| 2015 | $3,667 | $187,362 | $42,857 | $144,505 |
| 2014 | $3,481 | $183,732 | $42,018 | $141,714 |
Source: Public Records
Map
Nearby Homes
- 0 Mono Ave
- 0 Paula Ct Unit OR25099943
- 341 Table Mountain Blvd
- 77 Paula Ct
- 349 Table Mountain Blvd
- 66 Jasmine Ct
- 0 Cherokee Rd Unit PA24106650
- 55 Grand Ave
- 135 Morningstar Ave
- 0 Grand Ave
- 2181 4th St
- 2163 4th St
- 1972 Bluffs Dr
- 0 Bluffs Dr Unit 226005595
- 0 Lot 51 Plumas Ave
- 0 2nd St
- 405 Grand Ave
- 27 Riverview Terrace
- 1355 Safford St
- 1233 1st Ave
Your Personal Tour Guide
Ask me questions while you tour the home.