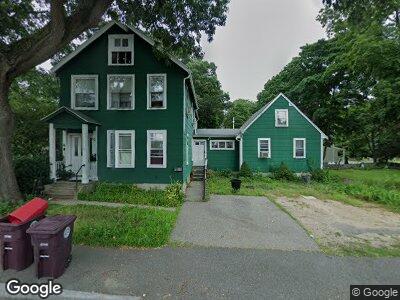
72 Norton St Unit 2 North Weymouth, MA 02191
Estimated Value: $707,000 - $780,000
1
Bed
1
Bath
700
Sq Ft
$1,049/Sq Ft
Est. Value
About This Home
This home is located at 72 Norton St Unit 2, North Weymouth, MA 02191 and is currently estimated at $734,576, approximately $1,049 per square foot. 72 Norton St Unit 2 is a home located in Norfolk County with nearby schools including Wessagusset Elementary School, Abigail Adams Middle School, and Weymouth Middle School Chapman.
Ownership History
Date
Name
Owned For
Owner Type
Purchase Details
Closed on
Sep 9, 2022
Sold by
Burke Brendan
Bought by
Burke Brendan and Burke Julie E
Current Estimated Value
Home Financials for this Owner
Home Financials are based on the most recent Mortgage that was taken out on this home.
Original Mortgage
$375,000
Outstanding Balance
$360,678
Interest Rate
5.22%
Mortgage Type
Stand Alone Refi Refinance Of Original Loan
Estimated Equity
$373,898
Purchase Details
Closed on
Nov 19, 2021
Sold by
Blais James F and Blais Brenda M
Bought by
Burke Brendan
Purchase Details
Closed on
Aug 24, 1990
Sold by
Ferguson Russell C
Bought by
Blais James F
Create a Home Valuation Report for This Property
The Home Valuation Report is an in-depth analysis detailing your home's value as well as a comparison with similar homes in the area
Home Values in the Area
Average Home Value in this Area
Purchase History
| Date | Buyer | Sale Price | Title Company |
|---|---|---|---|
| Burke Brendan | -- | None Available | |
| Burke Brendan | -- | None Available | |
| Burke Brendan | $515,000 | None Available | |
| Blais James F | $141,500 | -- | |
| Blais James F | $141,500 | -- |
Source: Public Records
Mortgage History
| Date | Status | Borrower | Loan Amount |
|---|---|---|---|
| Open | Burke Brendan | $375,000 | |
| Closed | Burke Brendan | $375,000 | |
| Previous Owner | Blais Brenda M | $120,000 | |
| Previous Owner | Blais James F | $261,933 | |
| Previous Owner | Blais James F | $262,000 | |
| Previous Owner | Blais James F | $15,000 | |
| Previous Owner | Blais Brenda M | $215,000 | |
| Previous Owner | Blais James F | $206,750 |
Source: Public Records
Tax History Compared to Growth
Tax History
| Year | Tax Paid | Tax Assessment Tax Assessment Total Assessment is a certain percentage of the fair market value that is determined by local assessors to be the total taxable value of land and additions on the property. | Land | Improvement |
|---|---|---|---|---|
| 2025 | $6,316 | $625,300 | $207,200 | $418,100 |
| 2024 | $6,116 | $595,500 | $197,300 | $398,200 |
| 2023 | $5,919 | $566,400 | $182,700 | $383,700 |
| 2022 | $5,735 | $500,400 | $169,200 | $331,200 |
| 2021 | $5,542 | $472,100 | $169,200 | $302,900 |
| 2020 | $5,353 | $449,100 | $169,200 | $279,900 |
| 2019 | $5,220 | $430,700 | $162,700 | $268,000 |
| 2018 | $4,810 | $384,800 | $154,900 | $229,900 |
| 2017 | $4,585 | $357,900 | $147,600 | $210,300 |
| 2016 | $4,301 | $336,000 | $141,900 | $194,100 |
| 2015 | $4,110 | $318,600 | $141,900 | $176,700 |
| 2014 | $4,025 | $302,600 | $132,000 | $170,600 |
Source: Public Records
Map
Nearby Homes
- 188 Idlewell Blvd
- 207 Evans St
- 25 Church St Unit 2
- 30 Katherine St
- 14 Crescent Rd
- 90 Sea St Unit 219
- 323 Green St
- 70 Biscayne Ave
- 9 Aspinwall Ave
- 208 Green St
- 100 Green St
- 10 Richards Rd
- 124 Mount Vernon Rd W
- 45 Doris Dr
- 6 Holbrook Rd
- 30 Lillian Rd
- 11 Holbrook Rd
- 26 Presidents Rd
- 18 Genevieve Rd
- 106 North St