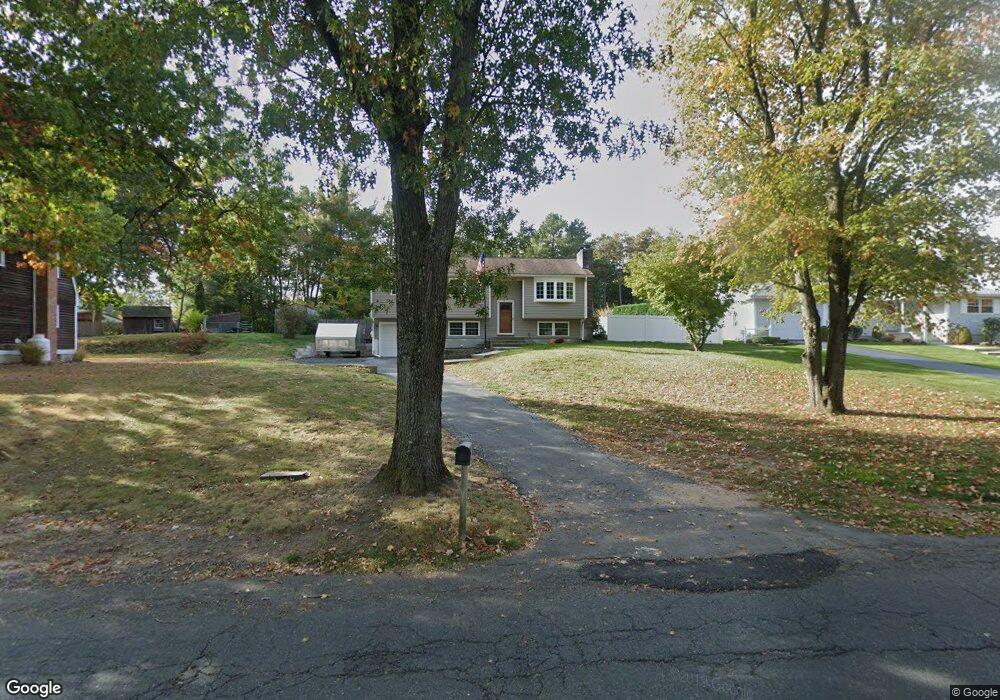
72 Phelps St Easthampton, MA 01027
Estimated Value: $321,000 - $369,000
3
Beds
2
Baths
994
Sq Ft
$353/Sq Ft
Est. Value
About This Home
This home is located at 72 Phelps St, Easthampton, MA 01027 and is currently estimated at $350,581, approximately $352 per square foot. 72 Phelps St is a home located in Hampshire County with nearby schools including Easthampton High School, Calvary Baptist Christian School, and Tri-County Schools.
Ownership History
Date
Name
Owned For
Owner Type
Purchase Details
Closed on
Oct 7, 1991
Sold by
Mitchell James B and Mitchell Josephine
Bought by
Kretchmar Darrell and Kretchmar Linda
Current Estimated Value
Purchase Details
Closed on
Mar 31, 1987
Sold by
Dastoli Donald A
Bought by
Mitchell James B
Create a Home Valuation Report for This Property
The Home Valuation Report is an in-depth analysis detailing your home's value as well as a comparison with similar homes in the area
Home Values in the Area
Average Home Value in this Area
Purchase History
| Date | Buyer | Sale Price | Title Company |
|---|---|---|---|
| Kretchmar Darrell | $119,900 | -- | |
| Mitchell James B | $120,000 | -- |
Source: Public Records
Mortgage History
| Date | Status | Borrower | Loan Amount |
|---|---|---|---|
| Open | Mitchell James B | $173,000 | |
| Closed | Mitchell James B | $164,000 |
Source: Public Records
Tax History
| Year | Tax Paid | Tax Assessment Tax Assessment Total Assessment is a certain percentage of the fair market value that is determined by local assessors to be the total taxable value of land and additions on the property. | Land | Improvement |
|---|---|---|---|---|
| 2025 | $4,681 | $342,400 | $128,900 | $213,500 |
| 2024 | $4,521 | $333,400 | $125,300 | $208,100 |
| 2023 | $3,529 | $240,900 | $99,500 | $141,400 |
| 2022 | $3,982 | $240,900 | $99,500 | $141,400 |
| 2021 | $4,345 | $247,700 | $99,500 | $148,200 |
| 2020 | $4,278 | $240,900 | $99,500 | $141,400 |
| 2019 | $3,724 | $240,900 | $99,500 | $141,400 |
| 2018 | $3,702 | $231,400 | $93,800 | $137,600 |
| 2017 | $3,621 | $223,400 | $90,200 | $133,200 |
| 2016 | $3,483 | $223,400 | $90,200 | $133,200 |
| 2015 | $3,385 | $223,400 | $90,200 | $133,200 |
Source: Public Records
Map
Nearby Homes
Your Personal Tour Guide
Ask me questions while you tour the home.