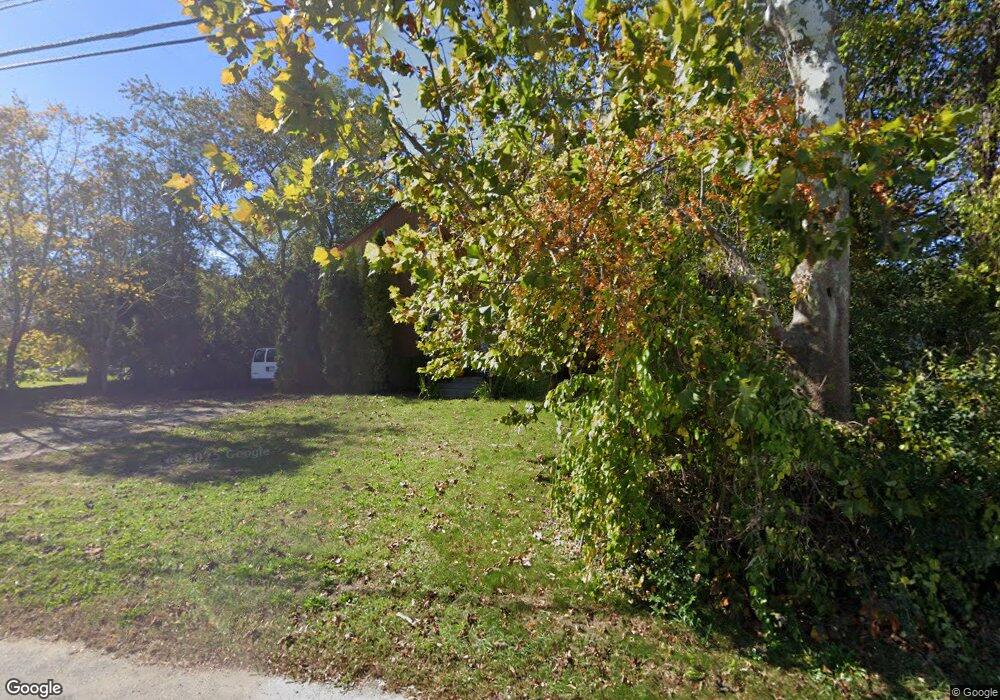
72 Plain St Rehoboth, MA 02769
Estimated Value: $432,328 - $524,000
2
Beds
1
Bath
1,540
Sq Ft
$316/Sq Ft
Est. Value
About This Home
This home is located at 72 Plain St, Rehoboth, MA 02769 and is currently estimated at $487,109, approximately $316 per square foot. 72 Plain St is a home located in Bristol County with nearby schools including Dighton-Rehoboth Regional High School and Cedar Brook School.
Ownership History
Date
Name
Owned For
Owner Type
Purchase Details
Closed on
Feb 6, 2025
Sold by
Smiley Michael J and Smiley Aline M
Bought by
Smiley
Current Estimated Value
Purchase Details
Closed on
Feb 24, 1994
Sold by
Amv W Chappell Post 63 and Ocallaghan Gerlad D
Bought by
Smiley Michael J and Smiley Aline M
Home Financials for this Owner
Home Financials are based on the most recent Mortgage that was taken out on this home.
Original Mortgage
$22,000
Interest Rate
6.96%
Mortgage Type
Purchase Money Mortgage
Create a Home Valuation Report for This Property
The Home Valuation Report is an in-depth analysis detailing your home's value as well as a comparison with similar homes in the area
Home Values in the Area
Average Home Value in this Area
Purchase History
| Date | Buyer | Sale Price | Title Company |
|---|---|---|---|
| Smiley | -- | None Available | |
| Smiley Michael J | $32,000 | -- |
Source: Public Records
Mortgage History
| Date | Status | Borrower | Loan Amount |
|---|---|---|---|
| Previous Owner | Smiley Michael J | $78,000 | |
| Previous Owner | Smiley Michael J | $80,000 | |
| Previous Owner | Smiley Michael J | $22,000 |
Source: Public Records
Tax History Compared to Growth
Tax History
| Year | Tax Paid | Tax Assessment Tax Assessment Total Assessment is a certain percentage of the fair market value that is determined by local assessors to be the total taxable value of land and additions on the property. | Land | Improvement |
|---|---|---|---|---|
| 2025 | $3,657 | $328,000 | $145,300 | $182,700 |
| 2024 | $3,456 | $304,200 | $145,300 | $158,900 |
| 2023 | $3,474 | $300,000 | $142,500 | $157,500 |
| 2022 | $3,482 | $274,800 | $142,500 | $132,300 |
| 2021 | $3,548 | $268,000 | $135,700 | $132,300 |
| 2020 | $3,447 | $262,700 | $135,700 | $127,000 |
| 2018 | $2,329 | $243,100 | $129,300 | $113,800 |
| 2017 | $2,820 | $224,500 | $129,300 | $95,200 |
| 2016 | $2,728 | $224,500 | $129,300 | $95,200 |
| 2015 | $2,621 | $212,900 | $123,100 | $89,800 |
| 2014 | $2,576 | $207,100 | $117,300 | $89,800 |
Source: Public Records
Map
Nearby Homes