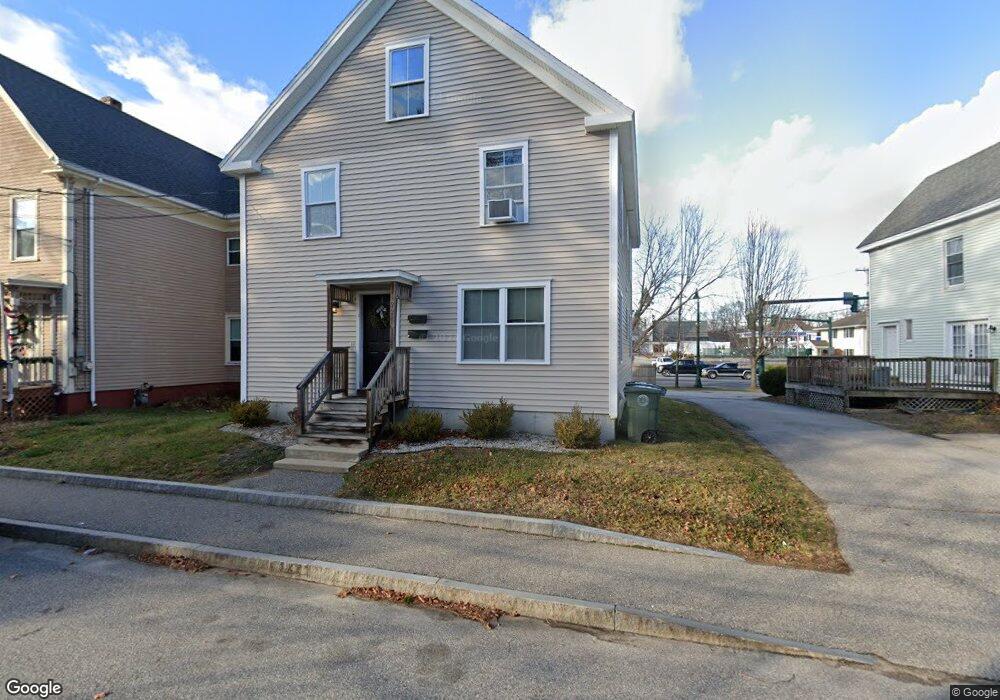
72 Pleasant St Westbrook, ME 04092
Estimated Value: $522,217 - $590,000
4
Beds
2
Baths
2,016
Sq Ft
$284/Sq Ft
Est. Value
About This Home
This home is located at 72 Pleasant St, Westbrook, ME 04092 and is currently estimated at $571,554, approximately $283 per square foot. 72 Pleasant St is a home located in Cumberland County with nearby schools including Westbrook High School, The Little Dolphin School Foundation, and Breakwater School.
Ownership History
Date
Name
Owned For
Owner Type
Purchase Details
Closed on
May 7, 2020
Sold by
Amm Management Llc
Bought by
Boissonneau Michael O and Boissonneau Alicia L
Current Estimated Value
Home Financials for this Owner
Home Financials are based on the most recent Mortgage that was taken out on this home.
Original Mortgage
$181,500
Outstanding Balance
$160,744
Interest Rate
3.5%
Mortgage Type
New Conventional
Estimated Equity
$410,810
Purchase Details
Closed on
Nov 27, 2006
Sold by
Nye William F and Hitchcock Anne M
Bought by
Boissonneau Alicia and Boissonneau Michael
Create a Home Valuation Report for This Property
The Home Valuation Report is an in-depth analysis detailing your home's value as well as a comparison with similar homes in the area
Home Values in the Area
Average Home Value in this Area
Purchase History
| Date | Buyer | Sale Price | Title Company |
|---|---|---|---|
| Boissonneau Michael O | -- | None Available | |
| Boissonneau Michael O | -- | None Available | |
| Boissonneau Alicia | -- | -- |
Source: Public Records
Mortgage History
| Date | Status | Borrower | Loan Amount |
|---|---|---|---|
| Open | Boissonneau Michael O | $181,500 | |
| Closed | Boissonneau Michael O | $181,500 |
Source: Public Records
Tax History Compared to Growth
Tax History
| Year | Tax Paid | Tax Assessment Tax Assessment Total Assessment is a certain percentage of the fair market value that is determined by local assessors to be the total taxable value of land and additions on the property. | Land | Improvement |
|---|---|---|---|---|
| 2023 | $5,293 | $317,300 | $86,900 | $230,400 |
| 2022 | $4,800 | $265,200 | $72,400 | $192,800 |
| 2021 | $4,729 | $265,200 | $72,400 | $192,800 |
| 2020 | $4,736 | $265,200 | $72,400 | $192,800 |
| 2019 | $4,736 | $265,200 | $72,400 | $192,800 |
| 2018 | $4,320 | $222,500 | $63,000 | $159,500 |
| 2017 | $4,201 | $222,500 | $63,000 | $159,500 |
| 2016 | $4,094 | $222,500 | $63,000 | $159,500 |
| 2015 | $3,996 | $222,500 | $63,000 | $159,500 |
| 2014 | $3,827 | $222,500 | $63,000 | $159,500 |
| 2013 | $3,827 | $222,500 | $63,000 | $159,500 |
Source: Public Records
Map
Nearby Homes
- 21 Clover Ln Unit 201
- 21 Clover Ln Unit 103
- 21 Clover Ln Unit 402
- 21 Clover Ln Unit 406
- 21 Clover Ln Unit 309
- 21 Clover Ln Unit 109
- 21 Clover Ln Unit 306
- 21 Clover Ln Unit 107
- 40 Oakland Ave
- 147 Spring St
- 18 Cole St
- 7 Union St
- 124 Brackett St
- 17 Mechanic St
- 77 Mechanic St
- 25 Lawrence St Unit 54
- 141 Rochester St
- 68 Seavey St
- 184 Central St
- 115 Saco St Unit 12