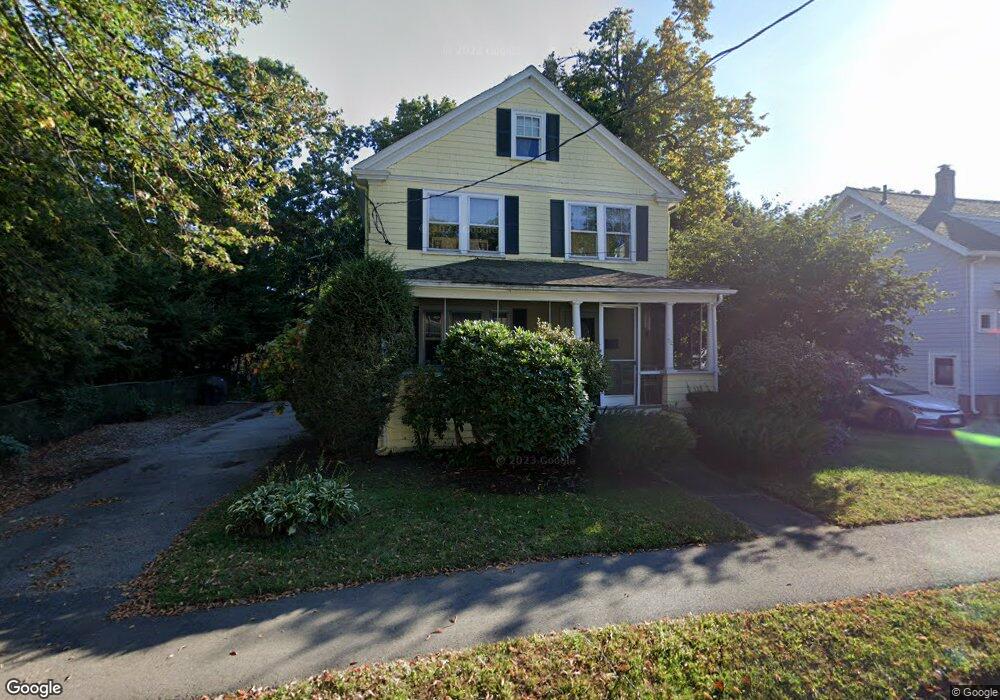
72 Powers St Needham, MA 02492
Estimated Value: $1,287,000 - $1,917,000
4
Beds
3
Baths
1,314
Sq Ft
$1,142/Sq Ft
Est. Value
About This Home
This home is located at 72 Powers St, Needham, MA 02492 and is currently estimated at $1,500,043, approximately $1,141 per square foot. 72 Powers St is a home located in Norfolk County with nearby schools including Mitchell Elementary School, High Rock Middle School, and Pollard Middle School.
Ownership History
Date
Name
Owned For
Owner Type
Purchase Details
Closed on
Oct 28, 2021
Sold by
Blackman Yvonne D and Blackman Steven I
Bought by
Blackman Yvonne D
Current Estimated Value
Home Financials for this Owner
Home Financials are based on the most recent Mortgage that was taken out on this home.
Original Mortgage
$400,000
Outstanding Balance
$259,725
Interest Rate
2.8%
Mortgage Type
Stand Alone Refi Refinance Of Original Loan
Estimated Equity
$1,240,318
Create a Home Valuation Report for This Property
The Home Valuation Report is an in-depth analysis detailing your home's value as well as a comparison with similar homes in the area
Home Values in the Area
Average Home Value in this Area
Purchase History
| Date | Buyer | Sale Price | Title Company |
|---|---|---|---|
| Blackman Yvonne D | -- | None Available | |
| Blackman Yvonne D | -- | None Available |
Source: Public Records
Mortgage History
| Date | Status | Borrower | Loan Amount |
|---|---|---|---|
| Open | Blackman Yvonne D | $400,000 |
Source: Public Records
Tax History Compared to Growth
Tax History
| Year | Tax Paid | Tax Assessment Tax Assessment Total Assessment is a certain percentage of the fair market value that is determined by local assessors to be the total taxable value of land and additions on the property. | Land | Improvement |
|---|---|---|---|---|
| 2025 | $11,631 | $1,097,300 | $788,200 | $309,100 |
| 2024 | $11,640 | $929,700 | $572,400 | $357,300 |
| 2023 | $11,805 | $905,300 | $572,400 | $332,900 |
| 2022 | $11,387 | $851,700 | $530,100 | $321,600 |
| 2021 | $11,098 | $851,700 | $530,100 | $321,600 |
| 2020 | $10,769 | $862,200 | $530,300 | $331,900 |
| 2019 | $10,000 | $807,100 | $482,100 | $325,000 |
| 2018 | $9,588 | $807,100 | $482,100 | $325,000 |
| 2017 | $9,189 | $772,800 | $482,100 | $290,700 |
| 2016 | $8,918 | $772,800 | $482,100 | $290,700 |
| 2015 | $8,725 | $772,800 | $482,100 | $290,700 |
| 2014 | $8,157 | $700,800 | $419,100 | $281,700 |
Source: Public Records
Map
Nearby Homes
- 40 Otis St Unit L
- 38 Otis St Unit 38
- 638 Webster St Unit 638
- 26 Pinewood Rd
- 556 Webster St
- 233 Warren St
- 193 Garden St
- 78 Birds Hill Ave
- 168 Richdale Rd
- 1011 Webster St
- 73 Maple St Unit 1
- 40 High St
- 90 Norfolk St
- 100 Rosemary Way Unit 129
- 100 Rosemary Way Unit 324
- 445 Hillside Ave
- 3 Crescent Rd
- 23 Cheney St
- a136 Hillside
- a136 Hillside Unit a