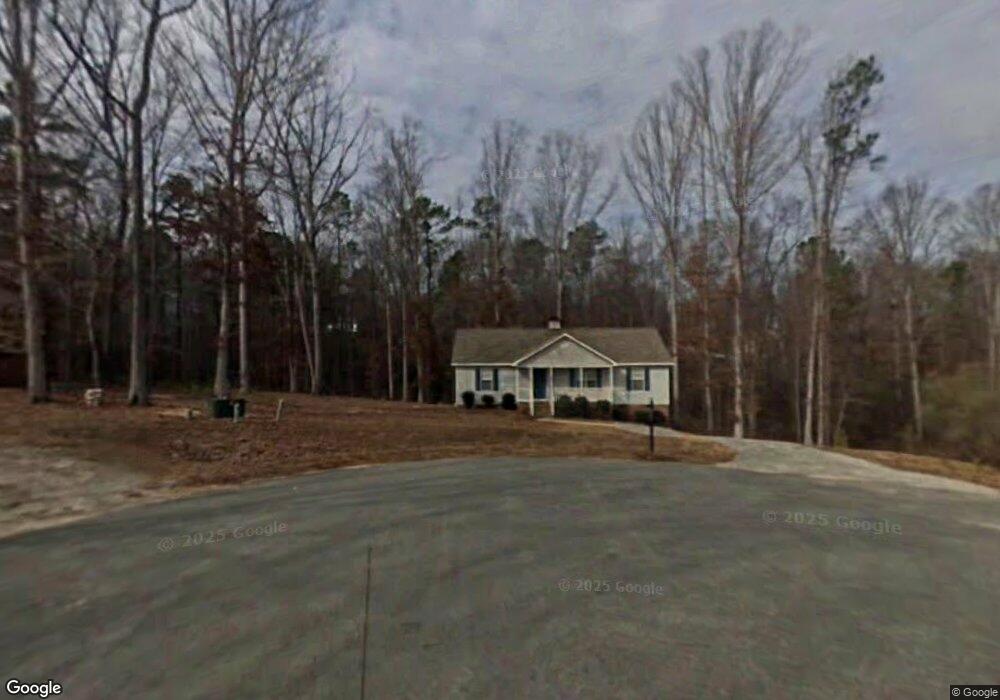
72 Rock Hurst Ct Raleigh, NC 27603
Estimated Value: $265,000 - $339,000
3
Beds
2
Baths
1,200
Sq Ft
$245/Sq Ft
Est. Value
About This Home
This home is located at 72 Rock Hurst Ct, Raleigh, NC 27603 and is currently estimated at $294,343, approximately $245 per square foot. 72 Rock Hurst Ct is a home located in Wake County with nearby schools including Dixon Road Elementary School, McGee's Crossroads Middle School, and West Johnston High School.
Ownership History
Date
Name
Owned For
Owner Type
Purchase Details
Closed on
Dec 31, 2007
Sold by
Andersen Richard and Andersen Margaret
Bought by
Fennell Shannon R
Current Estimated Value
Home Financials for this Owner
Home Financials are based on the most recent Mortgage that was taken out on this home.
Original Mortgage
$99,200
Outstanding Balance
$62,257
Interest Rate
6.05%
Mortgage Type
Purchase Money Mortgage
Estimated Equity
$232,086
Purchase Details
Closed on
Jul 17, 2007
Sold by
Hud
Bought by
Anderson Richard and Anderson Margaret
Purchase Details
Closed on
Jan 5, 2007
Sold by
Mcguire April D and Noufal Basil
Bought by
Hud
Purchase Details
Closed on
Apr 23, 2002
Sold by
Mcguire April D
Bought by
Comfort Homes Inc
Purchase Details
Closed on
Aug 3, 2001
Sold by
Comfort Homes Inc
Bought by
Deb Development Services Inc
Create a Home Valuation Report for This Property
The Home Valuation Report is an in-depth analysis detailing your home's value as well as a comparison with similar homes in the area
Home Values in the Area
Average Home Value in this Area
Purchase History
| Date | Buyer | Sale Price | Title Company |
|---|---|---|---|
| Fennell Shannon R | $124,000 | None Available | |
| Anderson Richard | -- | None Available | |
| Hud | -- | None Available | |
| Comfort Homes Inc | $109,000 | -- | |
| Deb Development Services Inc | -- | -- |
Source: Public Records
Mortgage History
| Date | Status | Borrower | Loan Amount |
|---|---|---|---|
| Open | Fennell Shannon R | $99,200 |
Source: Public Records
Tax History Compared to Growth
Tax History
| Year | Tax Paid | Tax Assessment Tax Assessment Total Assessment is a certain percentage of the fair market value that is determined by local assessors to be the total taxable value of land and additions on the property. | Land | Improvement |
|---|---|---|---|---|
| 2025 | $1,596 | $251,350 | $69,970 | $181,380 |
| 2024 | $1,176 | $145,150 | $45,980 | $99,170 |
| 2023 | $1,139 | $145,150 | $45,980 | $99,170 |
| 2022 | $1,176 | $145,150 | $45,980 | $99,170 |
| 2021 | $1,176 | $145,150 | $45,980 | $99,170 |
| 2020 | $1,219 | $145,150 | $45,980 | $99,170 |
| 2019 | $1,190 | $145,150 | $45,980 | $99,170 |
| 2018 | $918 | $109,230 | $32,990 | $76,240 |
| 2017 | $918 | $109,230 | $32,990 | $76,240 |
| 2016 | $918 | $109,230 | $32,990 | $76,240 |
| 2015 | $918 | $109,230 | $32,990 | $76,240 |
| 2014 | $918 | $109,230 | $32,990 | $76,240 |
Source: Public Records
Map
Nearby Homes
- 6908 Longridge Dr
- 221 Old Hickory Dr
- 272 Travel Lite Dr
- 618 Durwood Dr
- 595 Durwood Dr
- 7508 Frasier Fir Place
- 408 Johnston Rd
- 212 Fox Pen Dr
- 170 Sallyport Ct
- 6408 Glen Brack Ct
- 401 Blackberry Creek Dr
- 105 Huckleberry Ct
- 1021 Forest Glen Dr
- 149 Steep Rock Dr
- 895 November Ln
- 158 Linville Ln
- 834 November Ln
- 29 Linville Ln
- 6313 Southern Charm Ln
- 48 Banbury Ct
- 65 Rock Hurst Ct
- 6905 Longridge Dr
- 58 Rock Hurst Ct
- 47 Rock Hurst Ct
- 36 Rock Hurst Ct
- 6909 Longridge Dr
- 6901 Longridge Dr
- 6913 Longridge Dr
- 2015 Messer Rd
- 21 Rock Hurst Ct
- 6917 Longridge Dr
- 22 Rock Hurst Ct
- 6900 Longridge Dr
- 2013 Messer Rd
- 2017 Messer Rd
- 6921 Longridge Dr
- 2028 Messer Rd
- 6904 Longridge Dr
- 2009 Messer Rd
- 6916 Longridge Dr