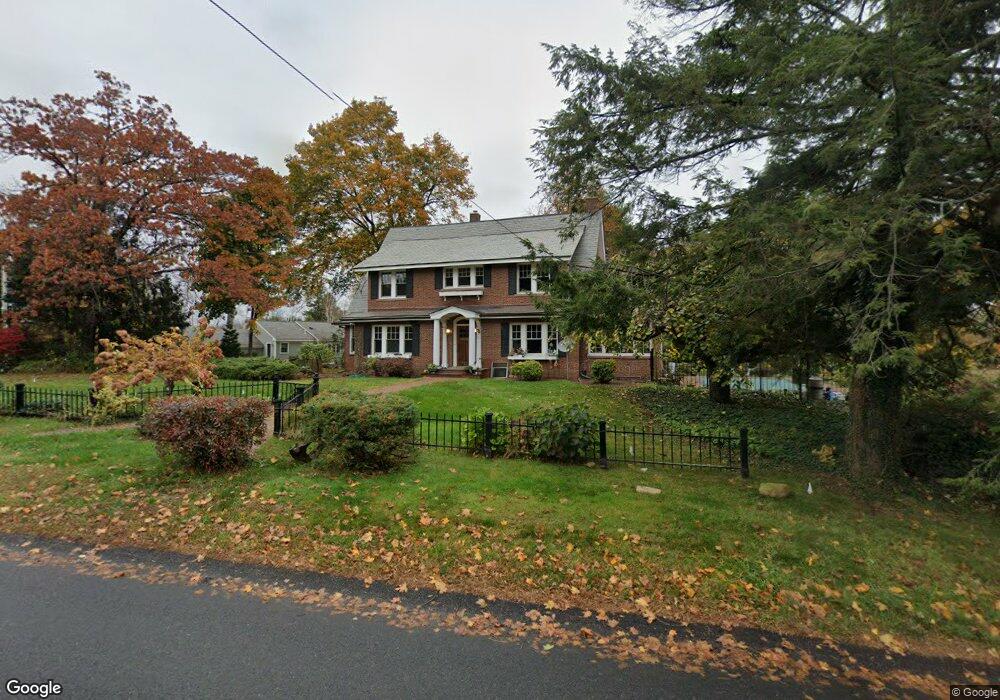
72 Salem St Andover, MA 01810
East Andover NeighborhoodEstimated Value: $1,285,000 - $2,404,000
3
Beds
3
Baths
2,805
Sq Ft
$575/Sq Ft
Est. Value
About This Home
This home is located at 72 Salem St, Andover, MA 01810 and is currently estimated at $1,611,817, approximately $574 per square foot. 72 Salem St is a home located in Essex County with nearby schools including Bancroft Elementary School, Doherty Middle School, and Andover High School.
Ownership History
Date
Name
Owned For
Owner Type
Purchase Details
Closed on
Sep 7, 1999
Sold by
Regan Julie R
Bought by
Tiwari Pundit T and Tiwari Carol J
Current Estimated Value
Home Financials for this Owner
Home Financials are based on the most recent Mortgage that was taken out on this home.
Original Mortgage
$413,000
Outstanding Balance
$119,433
Interest Rate
7.5%
Mortgage Type
Purchase Money Mortgage
Estimated Equity
$1,492,384
Create a Home Valuation Report for This Property
The Home Valuation Report is an in-depth analysis detailing your home's value as well as a comparison with similar homes in the area
Home Values in the Area
Average Home Value in this Area
Purchase History
| Date | Buyer | Sale Price | Title Company |
|---|---|---|---|
| Tiwari Pundit T | $590,000 | -- | |
| Tiwari Pundit T | $590,000 | -- |
Source: Public Records
Mortgage History
| Date | Status | Borrower | Loan Amount |
|---|---|---|---|
| Open | Tiwari Pundit T | $413,000 | |
| Closed | Tiwari Pundit T | $413,000 | |
| Previous Owner | Tiwari Pundit T | $120,000 | |
| Previous Owner | Tiwari Pundit T | $108,500 |
Source: Public Records
Tax History Compared to Growth
Tax History
| Year | Tax Paid | Tax Assessment Tax Assessment Total Assessment is a certain percentage of the fair market value that is determined by local assessors to be the total taxable value of land and additions on the property. | Land | Improvement |
|---|---|---|---|---|
| 2024 | $15,616 | $1,212,400 | $617,100 | $595,300 |
| 2023 | $14,926 | $1,092,700 | $556,000 | $536,700 |
| 2022 | $14,158 | $969,700 | $492,000 | $477,700 |
| 2021 | $13,541 | $885,600 | $447,200 | $438,400 |
| 2020 | $12,987 | $865,200 | $436,200 | $429,000 |
| 2019 | $12,876 | $843,200 | $423,400 | $419,800 |
| 2018 | $12,277 | $785,000 | $399,300 | $385,700 |
| 2017 | $11,748 | $773,900 | $391,400 | $382,500 |
| 2016 | $11,472 | $774,100 | $391,400 | $382,700 |
| 2015 | $11,033 | $737,000 | $376,300 | $360,700 |
Source: Public Records
Map
Nearby Homes
- 53 Salem St
- 104 Salem St
- 133B Salem
- 50 Hidden Rd
- 4 Hammond Way
- 31 Porter Rd
- 9 Chapman Ave
- 331 S Main St
- 204 Chestnut St
- 25 Timothy Dr
- 47 Abbot St
- 56 Sunset Rock Rd
- Lot 7 Weeping Willow Dr
- 32 Lucerne Dr
- 61 Elm St Unit 61
- 3 West Hollow
- 103 Central St
- 10 Maple Ave Unit 3
- 105 Central St
- 40 Ballardvale Rd