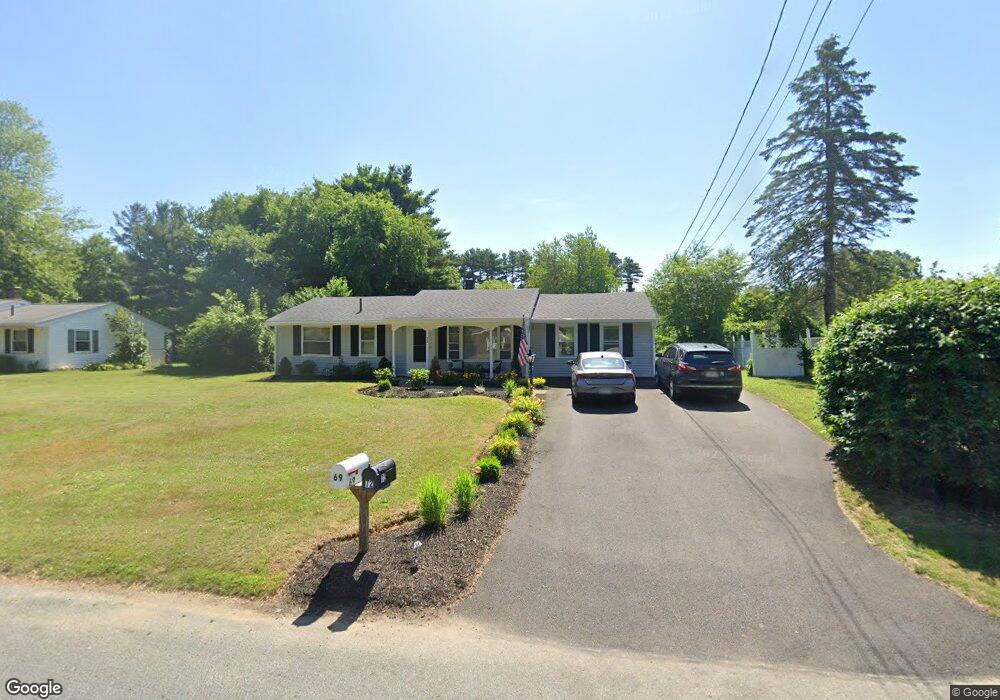
72 Sully Rd Raynham, MA 02767
Estimated Value: $484,547 - $513,000
3
Beds
1
Bath
1,248
Sq Ft
$402/Sq Ft
Est. Value
About This Home
This home is located at 72 Sully Rd, Raynham, MA 02767 and is currently estimated at $501,637, approximately $401 per square foot. 72 Sully Rd is a home located in Bristol County with nearby schools including Merrill Elementary School, LaLiberte Elementary School, and Williams Intermediate School.
Ownership History
Date
Name
Owned For
Owner Type
Purchase Details
Closed on
Sep 9, 1993
Sold by
Maguire Andrew J and Maguire Marion B
Bought by
Laro Lillian M
Current Estimated Value
Home Financials for this Owner
Home Financials are based on the most recent Mortgage that was taken out on this home.
Original Mortgage
$105,000
Interest Rate
7.21%
Mortgage Type
Purchase Money Mortgage
Create a Home Valuation Report for This Property
The Home Valuation Report is an in-depth analysis detailing your home's value as well as a comparison with similar homes in the area
Home Values in the Area
Average Home Value in this Area
Purchase History
| Date | Buyer | Sale Price | Title Company |
|---|---|---|---|
| Laro Lillian M | $105,000 | -- |
Source: Public Records
Mortgage History
| Date | Status | Borrower | Loan Amount |
|---|---|---|---|
| Open | Laro Lillian M | $12,000 | |
| Open | Laro Lillian M | $125,000 | |
| Closed | Laro Lillian M | $105,000 | |
| Previous Owner | Laro Lillian M | $31,000 |
Source: Public Records
Tax History
| Year | Tax Paid | Tax Assessment Tax Assessment Total Assessment is a certain percentage of the fair market value that is determined by local assessors to be the total taxable value of land and additions on the property. | Land | Improvement |
|---|---|---|---|---|
| 2025 | $4,861 | $401,700 | $207,600 | $194,100 |
| 2024 | $4,628 | $372,600 | $188,800 | $183,800 |
| 2023 | $4,478 | $329,300 | $169,900 | $159,400 |
| 2022 | $4,419 | $298,000 | $160,400 | $137,600 |
| 2021 | $4,165 | $283,500 | $151,000 | $132,500 |
| 2020 | $3,947 | $273,900 | $143,500 | $130,400 |
| 2019 | $3,762 | $264,400 | $134,000 | $130,400 |
| 2018 | $3,552 | $238,400 | $126,500 | $111,900 |
| 2017 | $3,328 | $221,400 | $120,800 | $100,600 |
| 2016 | $3,260 | $217,600 | $117,000 | $100,600 |
| 2015 | $3,117 | $204,500 | $122,000 | $82,500 |
Source: Public Records
Map
Nearby Homes
- 21 Sully Rd
- 30 Edward Rd
- 68 Michael Rd
- 53 Queens Cir
- 173 Titicut Rd
- 935 King St
- 224 Whippoorwill Dr
- 84 Diniz Dr
- 35 Spruce St
- 40 Country Club Dr
- 36 Stony Brook Rd
- 2 Maplewood Ln Unit 21-1
- 0 Maplewood Unit 21.3 73426136
- 30 Spruce St
- 4-B High Ridge Dr
- 698 Pine St
- 858 Pine St Unit Model
- 152 Forgeriver
- 208 S Main St
- 68 Beech St