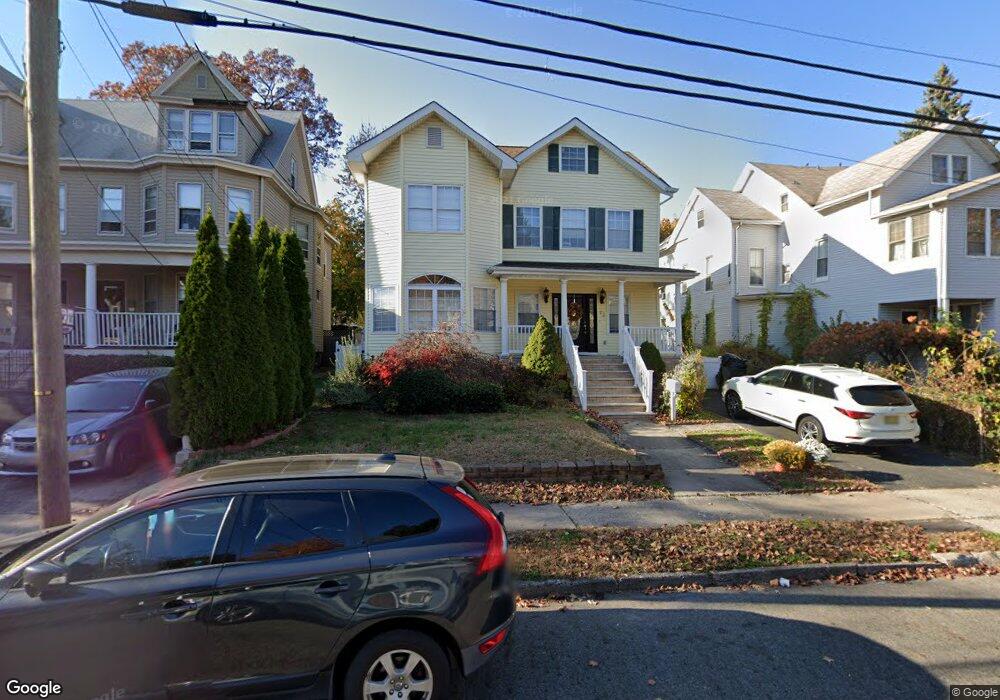
72 Sylvan St Rutherford, NJ 07070
Estimated Value: $908,877 - $1,136,000
5
Beds
4
Baths
2,982
Sq Ft
$343/Sq Ft
Est. Value
About This Home
This home is located at 72 Sylvan St, Rutherford, NJ 07070 and is currently estimated at $1,023,469, approximately $343 per square foot. 72 Sylvan St is a home located in Bergen County with nearby schools including Rutherford High School, Montessori School of East Rutherford, and The Academy at Saint Mary.
Ownership History
Date
Name
Owned For
Owner Type
Purchase Details
Closed on
Apr 19, 2010
Sold by
Hanna Monir and Hanna Sally
Bought by
Abadir Mina and Abadir Meret
Current Estimated Value
Home Financials for this Owner
Home Financials are based on the most recent Mortgage that was taken out on this home.
Original Mortgage
$385,000
Outstanding Balance
$256,296
Interest Rate
4.99%
Mortgage Type
Purchase Money Mortgage
Estimated Equity
$767,173
Create a Home Valuation Report for This Property
The Home Valuation Report is an in-depth analysis detailing your home's value as well as a comparison with similar homes in the area
Home Values in the Area
Average Home Value in this Area
Purchase History
| Date | Buyer | Sale Price | Title Company |
|---|---|---|---|
| Abadir Mina | $635,000 | -- |
Source: Public Records
Mortgage History
| Date | Status | Borrower | Loan Amount |
|---|---|---|---|
| Open | Abadir Mina | $385,000 |
Source: Public Records
Tax History
| Year | Tax Paid | Tax Assessment Tax Assessment Total Assessment is a certain percentage of the fair market value that is determined by local assessors to be the total taxable value of land and additions on the property. | Land | Improvement |
|---|---|---|---|---|
| 2025 | $17,634 | $565,000 | $262,400 | $302,600 |
| 2024 | $17,187 | $565,000 | $262,400 | $302,600 |
| 2023 | $16,775 | $565,000 | $262,400 | $302,600 |
| 2022 | $16,775 | $565,000 | $262,400 | $302,600 |
| 2021 | $16,549 | $565,000 | $262,400 | $302,600 |
| 2020 | $16,108 | $565,000 | $262,400 | $302,600 |
| 2019 | $15,475 | $565,000 | $262,400 | $302,600 |
| 2018 | $15,261 | $565,000 | $262,400 | $302,600 |
| 2017 | $15,046 | $565,000 | $262,400 | $302,600 |
| 2016 | $14,713 | $565,000 | $262,400 | $302,600 |
| 2015 | $14,311 | $565,000 | $262,400 | $302,600 |
| 2014 | $13,865 | $565,000 | $262,400 | $302,600 |
Source: Public Records
Map
Nearby Homes
- 114 Orient Way
- 130 Orient Way Unit 3D
- 130 Orient Way Unit 4H
- 87 Ridge Rd
- 27-39 Jackson
- 73 Addison Ave
- 166 Summit Cross
- 27 Donaldson Ave
- 1 Orient Way Unit 202
- 132 Union Ave Unit 405A
- 15 E Pierrepont Ave
- 222 Ridge Rd
- 121 Woodland Ave
- 155 Union Ave Unit 201
- 7 Delafield Ave
- 47 Elycroft Pkwy
- 10 Lynn Ct
- 331 Mountain Way
- 199 Union Ave Unit 2F
- 7 Edison Place
Your Personal Tour Guide
Ask me questions while you tour the home.