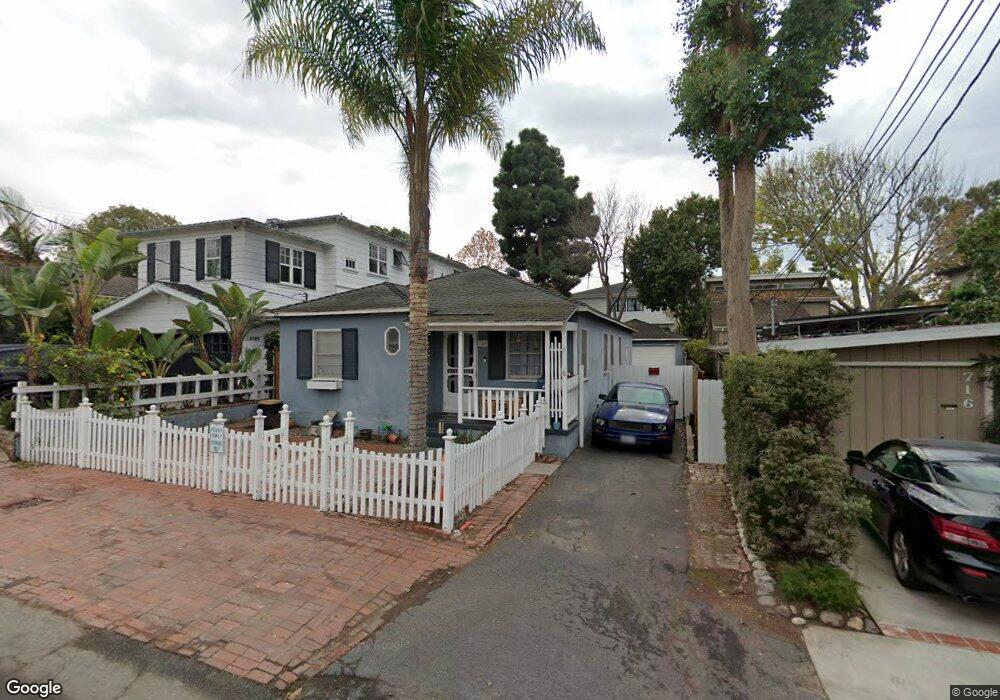
720 29th St Manhattan Beach, CA 90266
Estimated Value: $2,451,641 - $3,094,000
3
Beds
2
Baths
1,396
Sq Ft
$1,990/Sq Ft
Est. Value
About This Home
This home is located at 720 29th St, Manhattan Beach, CA 90266 and is currently estimated at $2,777,660, approximately $1,989 per square foot. 720 29th St is a home located in Los Angeles County with nearby schools including Grand View Elementary School, Manhattan Beach Middle School, and Mira Costa High School.
Ownership History
Date
Name
Owned For
Owner Type
Purchase Details
Closed on
Aug 2, 2020
Sold by
Millea Michael C and Millea Edwin F
Bought by
M8 Llc
Current Estimated Value
Purchase Details
Closed on
Jun 28, 2018
Sold by
Millea Robert Joseph
Bought by
Millea Robert Joseph and The Millea Survivor S Trust
Purchase Details
Closed on
Apr 4, 2016
Sold by
Millea Michael F
Bought by
Millea Robert Joseph and Millea Living Trust
Create a Home Valuation Report for This Property
The Home Valuation Report is an in-depth analysis detailing your home's value as well as a comparison with similar homes in the area
Home Values in the Area
Average Home Value in this Area
Purchase History
| Date | Buyer | Sale Price | Title Company |
|---|---|---|---|
| M8 Llc | -- | None Available | |
| Millea Michael C | -- | None Available | |
| Millea Robert Joseph | -- | None Available | |
| Millea Robert Joseph | -- | None Available | |
| Millea Robert Joseph | -- | Accommodation |
Source: Public Records
Tax History Compared to Growth
Tax History
| Year | Tax Paid | Tax Assessment Tax Assessment Total Assessment is a certain percentage of the fair market value that is determined by local assessors to be the total taxable value of land and additions on the property. | Land | Improvement |
|---|---|---|---|---|
| 2025 | $1,699 | $98,979 | $72,292 | $26,687 |
| 2024 | $1,699 | $97,039 | $70,875 | $26,164 |
| 2023 | $1,594 | $95,137 | $69,486 | $25,651 |
| 2022 | $1,575 | $93,273 | $68,124 | $25,149 |
| 2021 | $1,611 | $91,445 | $66,789 | $24,656 |
| 2020 | $1,599 | $90,509 | $66,105 | $24,404 |
| 2019 | $1,579 | $1,994,100 | $1,943,100 | $51,000 |
| 2018 | $1,508 | $86,996 | $63,539 | $23,457 |
| 2016 | $1,200 | $83,621 | $61,073 | $22,548 |
| 2015 | $1,179 | $82,366 | $60,156 | $22,210 |
| 2014 | $1,177 | $80,753 | $58,978 | $21,775 |
Source: Public Records
Map
Nearby Homes