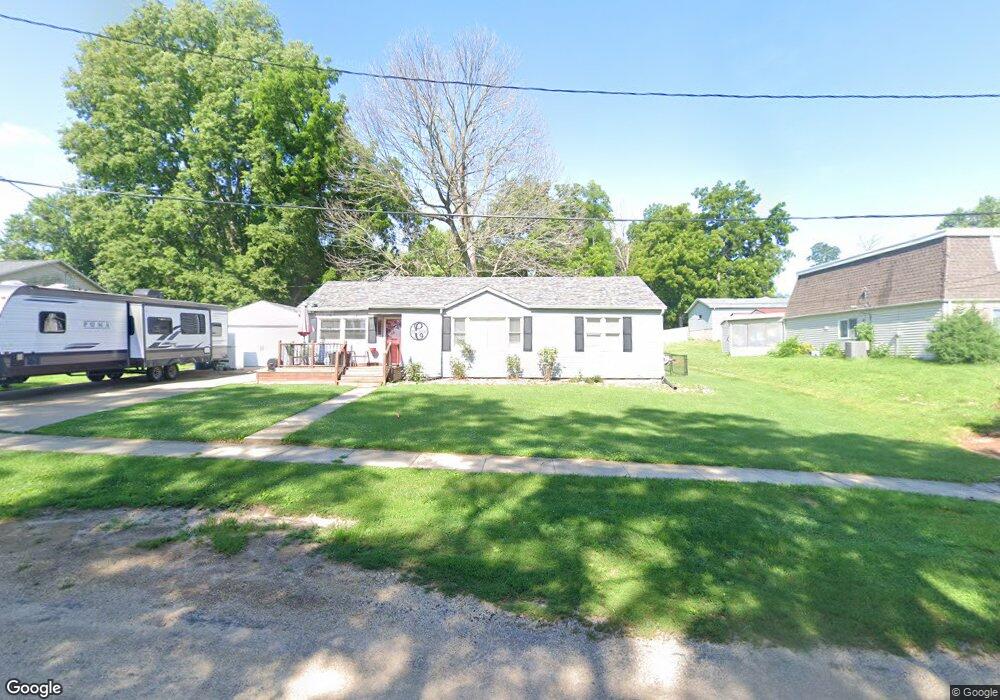
720 3rd St Princeton, IA 52768
Estimated Value: $182,588 - $198,000
3
Beds
1
Bath
1,206
Sq Ft
$158/Sq Ft
Est. Value
About This Home
This home is located at 720 3rd St, Princeton, IA 52768 and is currently estimated at $191,147, approximately $158 per square foot. 720 3rd St is a home located in Scott County with nearby schools including Virgil Grissom Elementary School, North Scott Junior High School, and North Scott Senior High School.
Ownership History
Date
Name
Owned For
Owner Type
Purchase Details
Closed on
Jan 14, 2010
Sold by
Kranz Leo H and Kranz Nancy J
Bought by
Carter Nicholas D and Carter Nicole B
Current Estimated Value
Home Financials for this Owner
Home Financials are based on the most recent Mortgage that was taken out on this home.
Original Mortgage
$124,500
Outstanding Balance
$80,704
Interest Rate
4.78%
Mortgage Type
New Conventional
Estimated Equity
$110,443
Purchase Details
Closed on
Mar 21, 2005
Sold by
Kranz Leo H and Kranz Nancy J
Bought by
Kranz Leo H and Kranz Nancy J
Create a Home Valuation Report for This Property
The Home Valuation Report is an in-depth analysis detailing your home's value as well as a comparison with similar homes in the area
Home Values in the Area
Average Home Value in this Area
Purchase History
| Date | Buyer | Sale Price | Title Company |
|---|---|---|---|
| Carter Nicholas D | $122,500 | None Available | |
| Kranz Leo H | -- | None Available |
Source: Public Records
Mortgage History
| Date | Status | Borrower | Loan Amount |
|---|---|---|---|
| Open | Carter Nicholas D | $124,500 |
Source: Public Records
Tax History
| Year | Tax Paid | Tax Assessment Tax Assessment Total Assessment is a certain percentage of the fair market value that is determined by local assessors to be the total taxable value of land and additions on the property. | Land | Improvement |
|---|---|---|---|---|
| 2025 | $2,272 | $168,300 | $27,800 | $140,500 |
| 2024 | $2,052 | $162,700 | $27,800 | $134,900 |
| 2023 | $1,896 | $162,700 | $27,800 | $134,900 |
| 2022 | $1,998 | $129,030 | $12,350 | $116,680 |
| 2021 | $1,998 | $129,030 | $12,350 | $116,680 |
| 2020 | $2,078 | $124,090 | $12,350 | $111,740 |
| 2019 | $2,084 | $124,270 | $12,350 | $111,920 |
| 2018 | $2,148 | $124,270 | $12,350 | $111,920 |
| 2017 | $1,942 | $124,270 | $12,350 | $111,920 |
| 2016 | $1,912 | $110,040 | $0 | $0 |
| 2015 | $1,912 | $105,160 | $0 | $0 |
| 2014 | $1,852 | $105,160 | $0 | $0 |
| 2013 | $1,824 | $0 | $0 | $0 |
| 2012 | -- | $105,350 | $12,350 | $93,000 |
Source: Public Records
Map
Nearby Homes
Your Personal Tour Guide
Ask me questions while you tour the home.