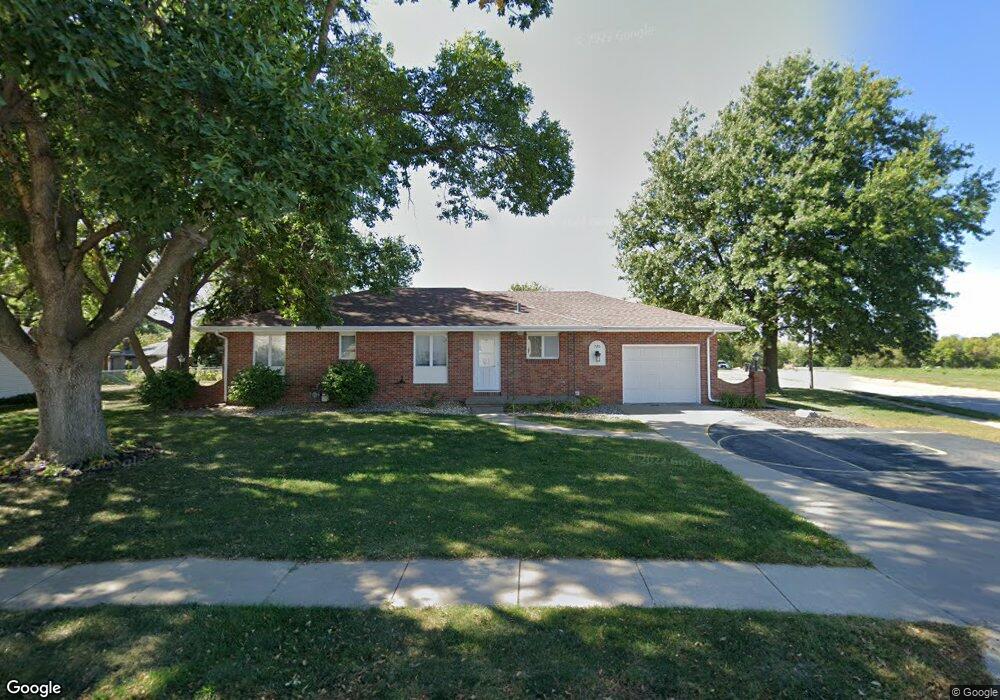
720 Apache Dr Gretna, NE 68028
Estimated Value: $252,000 - $364,000
4
Beds
4
Baths
2,202
Sq Ft
$133/Sq Ft
Est. Value
About This Home
This home is located at 720 Apache Dr, Gretna, NE 68028 and is currently estimated at $293,279, approximately $133 per square foot. 720 Apache Dr is a home located in Sarpy County with nearby schools including Gretna Elementary School, Gretna Middle School, and Gretna High School.
Ownership History
Date
Name
Owned For
Owner Type
Purchase Details
Closed on
Feb 5, 2016
Sold by
Bohling Todd M
Bought by
Fair Haven Way I Llc
Current Estimated Value
Purchase Details
Closed on
May 21, 2014
Sold by
Larson Janet L
Bought by
Bohling Todd M
Home Financials for this Owner
Home Financials are based on the most recent Mortgage that was taken out on this home.
Original Mortgage
$89,000
Interest Rate
4.35%
Purchase Details
Closed on
Apr 26, 2010
Sold by
Larson Jason A
Bought by
Larson Janet L
Purchase Details
Closed on
Apr 20, 2006
Sold by
Siedhoff Charlene G and Siedhoff William
Bought by
Larson Jason A and Larson Janet L
Home Financials for this Owner
Home Financials are based on the most recent Mortgage that was taken out on this home.
Original Mortgage
$139,000
Interest Rate
6.36%
Create a Home Valuation Report for This Property
The Home Valuation Report is an in-depth analysis detailing your home's value as well as a comparison with similar homes in the area
Home Values in the Area
Average Home Value in this Area
Purchase History
| Date | Buyer | Sale Price | Title Company |
|---|---|---|---|
| Fair Haven Way I Llc | -- | National Title Company As | |
| Bohling Todd M | $129,000 | National Title Company | |
| Larson Janet L | -- | None Available | |
| Larson Jason A | $139,000 | None Available |
Source: Public Records
Mortgage History
| Date | Status | Borrower | Loan Amount |
|---|---|---|---|
| Previous Owner | Bohling Todd M | $89,000 | |
| Previous Owner | Larson Jason A | $139,000 |
Source: Public Records
Tax History
| Year | Tax Paid | Tax Assessment Tax Assessment Total Assessment is a certain percentage of the fair market value that is determined by local assessors to be the total taxable value of land and additions on the property. | Land | Improvement |
|---|---|---|---|---|
| 2025 | $4,675 | $282,978 | $36,000 | $246,978 |
| 2024 | $4,915 | $259,897 | $33,000 | $226,897 |
| 2023 | $4,915 | $228,688 | $28,000 | $200,688 |
| 2022 | $4,757 | $208,450 | $26,000 | $182,450 |
| 2021 | $4,168 | $184,727 | $26,000 | $158,727 |
| 2020 | $3,747 | $167,035 | $26,000 | $141,035 |
| 2019 | $3,709 | $165,508 | $26,000 | $139,508 |
| 2018 | $3,647 | $163,524 | $19,000 | $144,524 |
| 2017 | $3,403 | $152,392 | $19,000 | $133,392 |
| 2016 | $3,297 | $148,016 | $19,000 | $129,016 |
| 2015 | $3,216 | $145,614 | $19,000 | $126,614 |
| 2014 | $3,174 | $144,946 | $19,000 | $125,946 |
| 2012 | -- | $144,358 | $19,000 | $125,358 |
Source: Public Records
Map
Nearby Homes
- 509 Pontiac Dr
- Lot 111 W Gruenther Rd
- Lot 127 W Gruenther Rd
- TBD Lot 64 W Gruenther Rd
- 230 Sycamore Cir
- Lot 80 W Gruenther Rd
- Lot 71 W Gruenther Rd
- TBD Lot 63 W Gruenther Rd
- 10910 S 210th St
- 21730 Parkview Dr
- 21821 Parkview Dr
- 21603 Parkview Dr
- 21726 Parkview Dr
- 21725 Parkview Dr
- 21710 Parkview Dr
- 21403 Mcclellan Cir
- 21707 Glenmore Dr
- 21711 Glenmore Dr
- 21716 Glenmore Dr
- 21910 Hampton Dr
- 313 Paradise Dr
- 714 Apache Dr
- 230 W Glenmore Dr
- 226 W Glenmore Dr
- 317 Paradise Dr
- 216 W Glenmore Dr
- 324 W Glenmore Dr
- 321 Paradise Dr
- 330 W Glenmore Dr
- 211 W Glenmore Dr Unit 213
- 211 W Glenmore Dr
- 325 Paradise Dr
- 334 W Glenmore Dr
- 701 Apache Dr
- 323 W Glenmore Dr
- 219 W Glenmore Dr
- 231 W Glenmore Dr
- 225 W Glenmore Dr
- 329 Paradise Dr
- 329 W Glenmore Dr
Your Personal Tour Guide
Ask me questions while you tour the home.