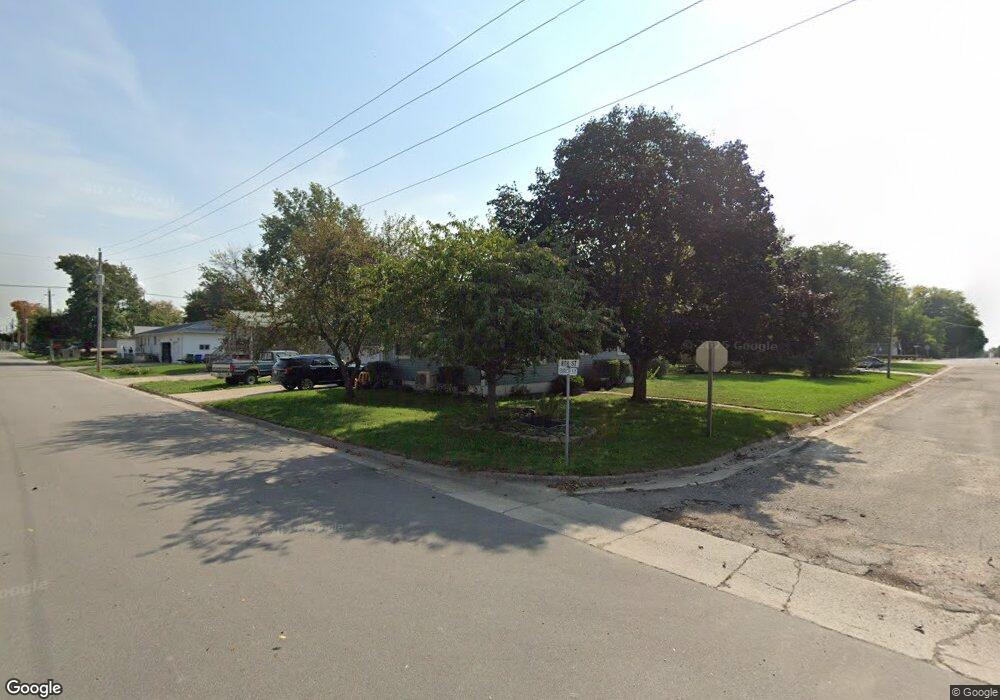
720 Birch St Allison, IA 50602
Estimated Value: $137,000 - $148,000
3
Beds
2
Baths
1,456
Sq Ft
$99/Sq Ft
Est. Value
About This Home
This home is located at 720 Birch St, Allison, IA 50602 and is currently estimated at $144,453, approximately $99 per square foot. 720 Birch St is a home located in Butler County with nearby schools including North Butler Elementary and North Butler Junior/Senior High School.
Ownership History
Date
Name
Owned For
Owner Type
Purchase Details
Closed on
Nov 11, 2024
Sold by
Cuvelier Samuel R
Bought by
Cuvelier Samuel R and Cuvelier Brittany Craun
Current Estimated Value
Purchase Details
Closed on
Jun 5, 2015
Sold by
Dralle Daniel and Dralle Wendy J
Bought by
Cuveliet Samuel R
Home Financials for this Owner
Home Financials are based on the most recent Mortgage that was taken out on this home.
Original Mortgage
$11,700
Interest Rate
0.78%
Mortgage Type
New Conventional
Create a Home Valuation Report for This Property
The Home Valuation Report is an in-depth analysis detailing your home's value as well as a comparison with similar homes in the area
Purchase History
| Date | Buyer | Sale Price | Title Company |
|---|---|---|---|
| Cuvelier Samuel R | -- | None Listed On Document | |
| Cuveliet Samuel R | $78,000 | None Available |
Source: Public Records
Mortgage History
| Date | Status | Borrower | Loan Amount |
|---|---|---|---|
| Previous Owner | Cuveliet Samuel R | $11,700 | |
| Previous Owner | Cuveliet Samuel R | $62,400 |
Source: Public Records
Tax History
| Year | Tax Paid | Tax Assessment Tax Assessment Total Assessment is a certain percentage of the fair market value that is determined by local assessors to be the total taxable value of land and additions on the property. | Land | Improvement |
|---|---|---|---|---|
| 2025 | $1,786 | $112,280 | $10,650 | $101,630 |
| 2024 | $1,786 | $112,830 | $10,650 | $102,180 |
| 2023 | $1,716 | $112,830 | $10,650 | $102,180 |
| 2022 | $1,630 | $97,390 | $10,650 | $86,740 |
| 2021 | $1,568 | $97,390 | $10,650 | $86,740 |
| 2020 | $1,568 | $86,460 | $10,650 | $75,810 |
| 2019 | $1,438 | $79,900 | $10,650 | $75,810 |
| 2018 | $1,530 | $79,900 | $0 | $0 |
| 2017 | $1,530 | $79,900 | $0 | $0 |
| 2016 | $1,386 | $71,020 | $0 | $0 |
| 2015 | $1,386 | $71,020 | $0 | $0 |
| 2014 | $1,370 | $71,020 | $0 | $0 |
Source: Public Records
Map
Nearby Homes
Your Personal Tour Guide
Ask me questions while you tour the home.